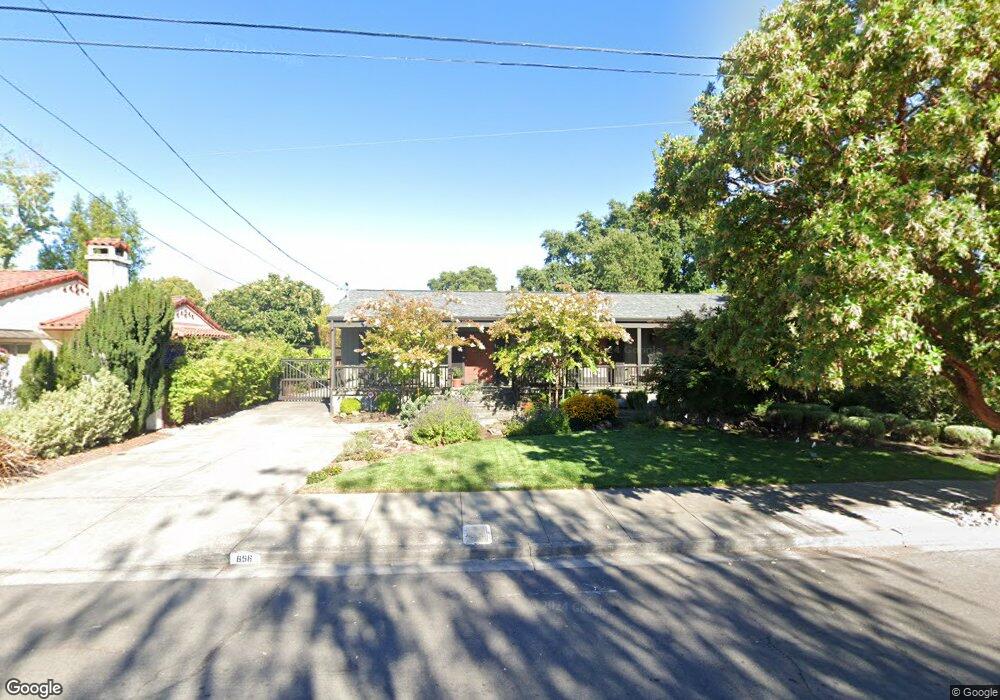
656 Austin Ave Sonoma, CA 95476
Estimated Value: $1,613,000 - $2,712,000
4
Beds
3
Baths
2,972
Sq Ft
$712/Sq Ft
Est. Value
About This Home
This home is located at 656 Austin Ave, Sonoma, CA 95476 and is currently estimated at $2,116,599, approximately $712 per square foot. 656 Austin Ave is a home located in Sonoma County with nearby schools including Prestwood Elementary School, Adele Harrison Middle School, and Creekside High School.
Ownership History
Date
Name
Owned For
Owner Type
Purchase Details
Closed on
May 23, 2024
Sold by
Susan And Ronald Ostertag 2021 Revocable and Ostertag Susan J
Bought by
Susan And Ronald Ostertag 2021 Revocable Fami and Ostertag
Current Estimated Value
Purchase Details
Closed on
Apr 20, 2021
Sold by
Ostertag Susan J
Bought by
Ostertag Susan J and Ostertag Ronald A
Purchase Details
Closed on
Aug 16, 1994
Sold by
Dodson Jack Eugene
Bought by
Ostertag Susan J
Purchase Details
Closed on
Aug 2, 1994
Sold by
Dodson Florence J
Bought by
Dodson Jack Eugene
Create a Home Valuation Report for This Property
The Home Valuation Report is an in-depth analysis detailing your home's value as well as a comparison with similar homes in the area
Home Values in the Area
Average Home Value in this Area
Purchase History
| Date | Buyer | Sale Price | Title Company |
|---|---|---|---|
| Susan And Ronald Ostertag 2021 Revocable Fami | -- | None Listed On Document | |
| Ostertag Susan J | -- | None Available | |
| Ostertag Susan J | -- | -- | |
| Dodson Jack Eugene | -- | -- | |
| Dodson Florence J | -- | -- |
Source: Public Records
Tax History Compared to Growth
Tax History
| Year | Tax Paid | Tax Assessment Tax Assessment Total Assessment is a certain percentage of the fair market value that is determined by local assessors to be the total taxable value of land and additions on the property. | Land | Improvement |
|---|---|---|---|---|
| 2025 | $3,477 | $203,655 | $34,099 | $169,556 |
| 2024 | $3,477 | $199,663 | $33,431 | $166,232 |
| 2023 | $3,477 | $195,749 | $32,776 | $162,973 |
| 2022 | $3,393 | $191,912 | $32,134 | $159,778 |
| 2021 | $3,515 | $188,150 | $31,504 | $156,646 |
| 2020 | $3,402 | $186,221 | $31,181 | $155,040 |
| 2019 | $3,323 | $182,570 | $30,570 | $152,000 |
| 2018 | $3,191 | $178,991 | $29,971 | $149,020 |
| 2017 | $4,661 | $175,483 | $29,384 | $146,099 |
| 2016 | $2,978 | $172,043 | $28,808 | $143,235 |
| 2015 | $2,884 | $169,460 | $28,376 | $141,084 |
| 2014 | $2,937 | $166,142 | $27,821 | $138,321 |
Source: Public Records
Map
Nearby Homes