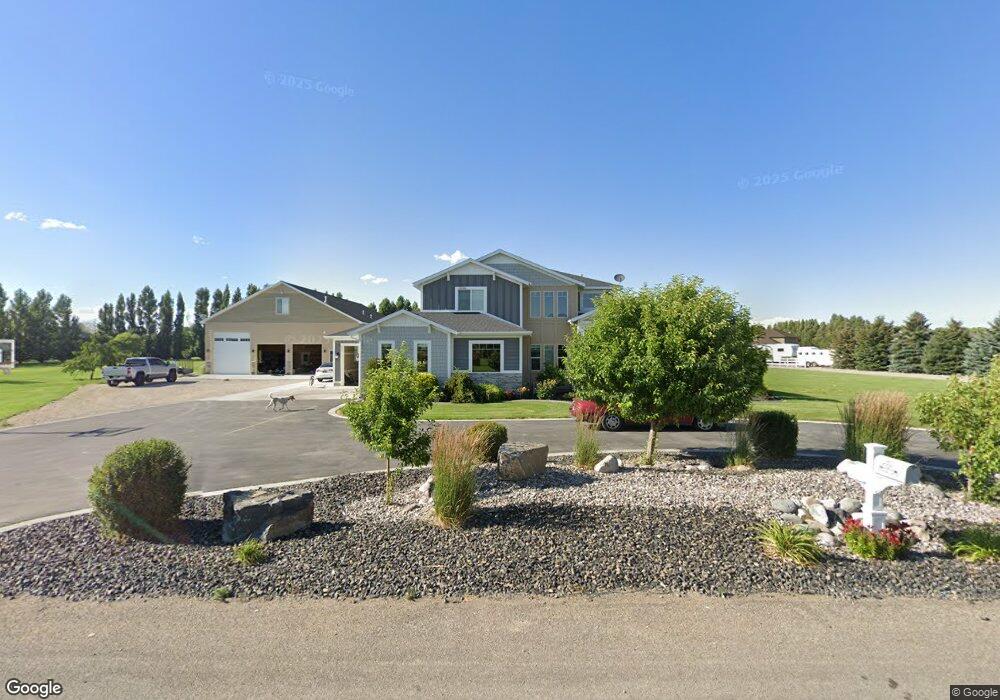
658 W 45 S Blackfoot, ID 83221
Estimated Value: $619,000 - $782,000
--
Bed
--
Bath
2,742
Sq Ft
$253/Sq Ft
Est. Value
About This Home
This home is located at 658 W 45 S, Blackfoot, ID 83221 and is currently estimated at $693,823, approximately $253 per square foot. 658 W 45 S is a home with nearby schools including Riverside Elementary School, Moreland Elementary School, and Rockford Elementary School.
Ownership History
Date
Name
Owned For
Owner Type
Purchase Details
Closed on
May 23, 2024
Sold by
Lee Dewight and Lee Lyndsay
Bought by
Robbins Travis Kott and Robbins Taya
Current Estimated Value
Purchase Details
Closed on
Nov 18, 2016
Sold by
Lee Dewight Merwin and Lee Lyndsay Rae
Bought by
Lee Dewight and Lee Lyndsay
Home Financials for this Owner
Home Financials are based on the most recent Mortgage that was taken out on this home.
Original Mortgage
$348,000
Interest Rate
3.47%
Mortgage Type
New Conventional
Purchase Details
Closed on
Feb 25, 2016
Sold by
Farm Kids Llc
Bought by
Lee Dewight Merwin and Lee Lundsay Rae
Home Financials for this Owner
Home Financials are based on the most recent Mortgage that was taken out on this home.
Original Mortgage
$413,250
Interest Rate
3.92%
Mortgage Type
New Conventional
Create a Home Valuation Report for This Property
The Home Valuation Report is an in-depth analysis detailing your home's value as well as a comparison with similar homes in the area
Home Values in the Area
Average Home Value in this Area
Purchase History
| Date | Buyer | Sale Price | Title Company |
|---|---|---|---|
| Robbins Travis Kott | -- | Flying S Title And Escrow | |
| Lee Dewight | -- | First American Title Blackfo | |
| Lee Dewight Merwin | -- | First American Title Blackfo |
Source: Public Records
Mortgage History
| Date | Status | Borrower | Loan Amount |
|---|---|---|---|
| Previous Owner | Lee Dewight | $348,000 | |
| Previous Owner | Lee Dewight Merwin | $413,250 |
Source: Public Records
Tax History Compared to Growth
Tax History
| Year | Tax Paid | Tax Assessment Tax Assessment Total Assessment is a certain percentage of the fair market value that is determined by local assessors to be the total taxable value of land and additions on the property. | Land | Improvement |
|---|---|---|---|---|
| 2025 | $2,586 | $637,455 | $100,120 | $537,335 |
| 2024 | $2,586 | $617,455 | $80,120 | $537,335 |
| 2023 | $3,075 | $617,455 | $80,120 | $537,335 |
| 2022 | $5,694 | $530,292 | $67,072 | $463,220 |
| 2021 | $3,965 | $461,872 | $59,072 | $402,800 |
| 2020 | $3,169 | $344,036 | $0 | $0 |
| 2019 | $3,478 | $344,036 | $0 | $0 |
| 2018 | $3,751 | $344,036 | $38,036 | $306,000 |
| 2017 | $3,719 | $336,030 | $30,030 | $306,000 |
| 2016 | $26 | $1,665 | $0 | $0 |
| 2015 | $24 | $1,665 | $0 | $0 |
| 2014 | $23 | $1,665 | $1,665 | $0 |
Source: Public Records
Map
Nearby Homes