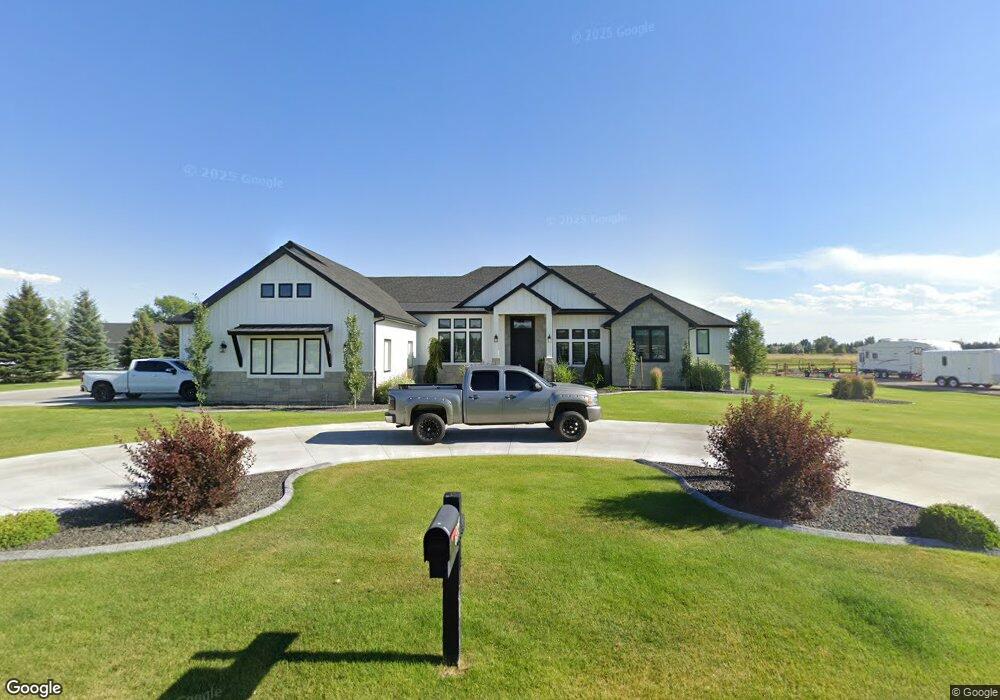
659 W 45 S Blackfoot, ID 83221
Estimated Value: $657,000 - $1,180,328
5
Beds
6
Baths
3,412
Sq Ft
$294/Sq Ft
Est. Value
About This Home
This home is located at 659 W 45 S, Blackfoot, ID 83221 and is currently estimated at $1,003,443, approximately $294 per square foot. 659 W 45 S is a home with nearby schools including Riverside Elementary School, Moreland Elementary School, and Rockford Elementary School.
Ownership History
Date
Name
Owned For
Owner Type
Purchase Details
Closed on
Jul 24, 2024
Sold by
Wootton Development Llc
Bought by
Dance Bryan
Current Estimated Value
Home Financials for this Owner
Home Financials are based on the most recent Mortgage that was taken out on this home.
Original Mortgage
$415,000
Interest Rate
6.47%
Mortgage Type
Credit Line Revolving
Purchase Details
Closed on
Mar 8, 2023
Sold by
Rick Roberts Educational Trust
Bought by
Dance Bryan and Dance Jessica
Purchase Details
Closed on
Jun 11, 2019
Sold by
Dance Jessica and Dance Bryan
Bought by
Dance Bryan
Home Financials for this Owner
Home Financials are based on the most recent Mortgage that was taken out on this home.
Original Mortgage
$620,000
Interest Rate
4.1%
Mortgage Type
Construction
Purchase Details
Closed on
Sep 27, 2018
Sold by
Farm Kids Llc
Bought by
Dance Brian and Dance Jessica
Create a Home Valuation Report for This Property
The Home Valuation Report is an in-depth analysis detailing your home's value as well as a comparison with similar homes in the area
Home Values in the Area
Average Home Value in this Area
Purchase History
| Date | Buyer | Sale Price | Title Company |
|---|---|---|---|
| Dance Bryan | -- | Alliance Title | |
| Dance Bryan | -- | Alliance Title | |
| Dance Bryan | -- | First American Title Blackfo | |
| Dance Brian | -- | None Available |
Source: Public Records
Mortgage History
| Date | Status | Borrower | Loan Amount |
|---|---|---|---|
| Previous Owner | Dance Bryan | $415,000 | |
| Previous Owner | Dance Bryan | $620,000 |
Source: Public Records
Tax History Compared to Growth
Tax History
| Year | Tax Paid | Tax Assessment Tax Assessment Total Assessment is a certain percentage of the fair market value that is determined by local assessors to be the total taxable value of land and additions on the property. | Land | Improvement |
|---|---|---|---|---|
| 2025 | $4,567 | $1,025,188 | $93,420 | $931,768 |
| 2024 | $4,567 | $1,005,188 | $73,420 | $931,768 |
| 2023 | $4,309 | $1,005,188 | $73,420 | $931,768 |
| 2022 | $10,512 | $873,285 | $63,052 | $810,233 |
| 2021 | $7,425 | $759,602 | $55,052 | $704,550 |
| 2020 | $384 | $30,026 | $0 | $0 |
| 2019 | $19 | $1,387 | $0 | $0 |
| 2018 | $21 | $1,387 | $1,387 | $0 |
| 2017 | $22 | $1,387 | $1,387 | $0 |
| 2016 | $21 | $1,387 | $0 | $0 |
| 2015 | $19 | $1,387 | $0 | $0 |
| 2014 | $19 | $1,387 | $1,387 | $0 |
Source: Public Records
Map
Nearby Homes