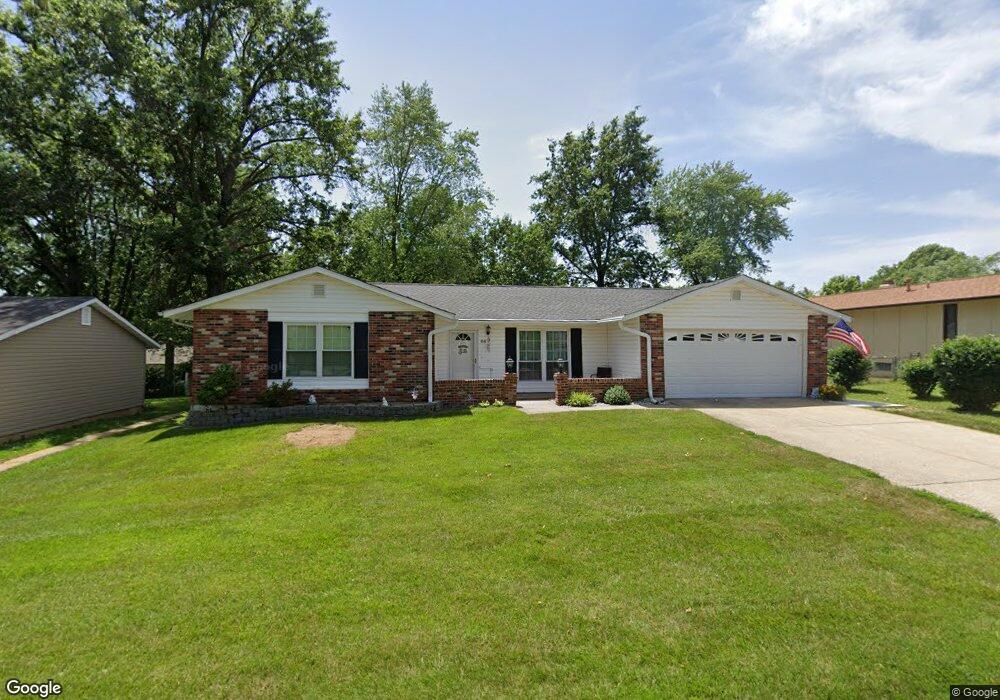
66 Atwater Dr Saint Peters, MO 63376
Estimated Value: $315,000 - $348,000
3
Beds
2
Baths
1,720
Sq Ft
$192/Sq Ft
Est. Value
About This Home
This home is located at 66 Atwater Dr, Saint Peters, MO 63376 and is currently estimated at $330,996, approximately $192 per square foot. 66 Atwater Dr is a home located in St. Charles County with nearby schools including Fairmount Elementary School, Saeger Middle School, and Francis Howell Central High School.
Ownership History
Date
Name
Owned For
Owner Type
Purchase Details
Closed on
Jul 13, 2021
Sold by
Whitehead Kenneth
Bought by
Whitehead Tamara
Current Estimated Value
Purchase Details
Closed on
Aug 6, 2001
Sold by
Hicks Karen Anderson and Hicks James Monroe
Bought by
Sullentrup Stanley R and Sullentrup Kathleen M
Home Financials for this Owner
Home Financials are based on the most recent Mortgage that was taken out on this home.
Original Mortgage
$92,000
Outstanding Balance
$35,862
Interest Rate
7.14%
Estimated Equity
$295,134
Purchase Details
Closed on
Nov 14, 2000
Sold by
Hicks James Monroe
Bought by
Hicks James Monroe and Hicks Karen Anderson
Purchase Details
Closed on
Jul 13, 1998
Sold by
Hicks Elizabeth Jane
Bought by
Hicks James Monroe
Home Financials for this Owner
Home Financials are based on the most recent Mortgage that was taken out on this home.
Original Mortgage
$78,400
Interest Rate
7.05%
Create a Home Valuation Report for This Property
The Home Valuation Report is an in-depth analysis detailing your home's value as well as a comparison with similar homes in the area
Home Values in the Area
Average Home Value in this Area
Purchase History
| Date | Buyer | Sale Price | Title Company |
|---|---|---|---|
| Whitehead Tamara | -- | Title Partners Agency Llc | |
| Sullentrup Kathleen M | -- | Title Partners Agency Llc | |
| Sullentrup Stanley R | $122,000 | -- | |
| Hicks James Monroe | -- | -- | |
| Hicks James Monroe | -- | -- |
Source: Public Records
Mortgage History
| Date | Status | Borrower | Loan Amount |
|---|---|---|---|
| Open | Sullentrup Stanley R | $92,000 | |
| Previous Owner | Hicks James Monroe | $78,400 |
Source: Public Records
Tax History Compared to Growth
Tax History
| Year | Tax Paid | Tax Assessment Tax Assessment Total Assessment is a certain percentage of the fair market value that is determined by local assessors to be the total taxable value of land and additions on the property. | Land | Improvement |
|---|---|---|---|---|
| 2025 | $3,127 | $55,060 | -- | -- |
| 2023 | $3,122 | $50,454 | $0 | $0 |
| 2022 | $2,716 | $40,603 | $0 | $0 |
| 2021 | $2,710 | $40,603 | $0 | $0 |
| 2020 | $2,417 | $35,260 | $0 | $0 |
| 2019 | $2,408 | $35,260 | $0 | $0 |
| 2018 | $2,538 | $35,501 | $0 | $0 |
| 2017 | $2,525 | $35,501 | $0 | $0 |
| 2016 | $2,190 | $30,835 | $0 | $0 |
| 2015 | $2,157 | $30,835 | $0 | $0 |
| 2014 | $2,108 | $29,210 | $0 | $0 |
Source: Public Records
Map
Nearby Homes
- 51 Park Charles Blvd S Unit D
- 35 Big Oak Dr
- 9 Wild Cherry Dr
- 21 Park Charles Blvd N Unit D
- 4204 Elkhart Lake Rd
- 9 Linda Ln
- 21 Kenworth Dr
- 6 Green Valley Dr
- 11 White Oak Dr
- 646 Watkins Glen Dr
- 31 Danson Dr
- 25 Lakemont Dr
- 1323 Pegasus Trail
- 7 Marveline Dr
- 128 Vistalago Place
- 212 Agamemnon Ct
- 228 Hunters Pointe Dr
- 4146 Current Dr
- 609 Westbridge Dr
- 5 Victoria Square