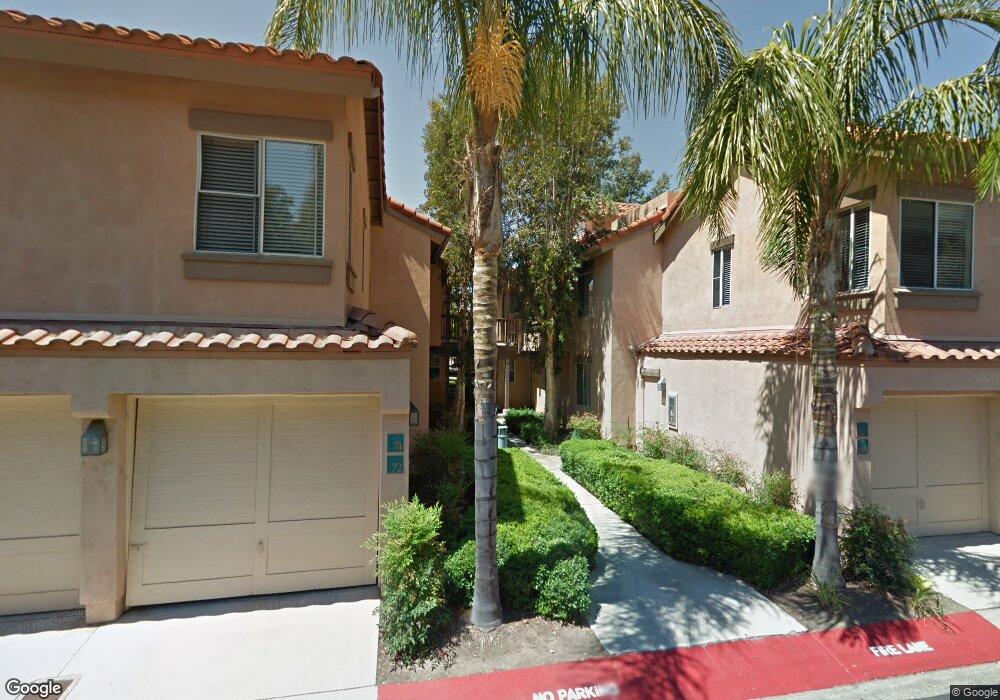
66 Lobelia Unit 45 Rancho Santa Margarita, CA 92688
Estimated Value: $624,599
2
Beds
2
Baths
922
Sq Ft
$677/Sq Ft
Est. Value
About This Home
This home is located at 66 Lobelia Unit 45, Rancho Santa Margarita, CA 92688 and is currently priced at $624,599, approximately $677 per square foot. 66 Lobelia Unit 45 is a home located in Orange County with nearby schools including Trabuco Mesa Elementary School, Rancho Santa Margarita Intermediate School, and Trabuco Hills High School.
Ownership History
Date
Name
Owned For
Owner Type
Purchase Details
Closed on
Sep 19, 2011
Sold by
Affordable Housing Clearinghouse
Bought by
Veneman Holly
Current Estimated Value
Home Financials for this Owner
Home Financials are based on the most recent Mortgage that was taken out on this home.
Original Mortgage
$159,665
Interest Rate
4.06%
Mortgage Type
New Conventional
Purchase Details
Closed on
Apr 18, 2011
Sold by
Federal Home Loan Mortgage Corporation
Bought by
Affordable Housing Clearinghouse
Home Financials for this Owner
Home Financials are based on the most recent Mortgage that was taken out on this home.
Original Mortgage
$193,230
Interest Rate
4.71%
Mortgage Type
Purchase Money Mortgage
Purchase Details
Closed on
Apr 22, 2010
Sold by
Souleiman Aida
Bought by
Federal Home Loan Mortgage Corporation
Purchase Details
Closed on
Mar 7, 2005
Sold by
Mathes Dustin
Bought by
Lemus Catherine
Home Financials for this Owner
Home Financials are based on the most recent Mortgage that was taken out on this home.
Original Mortgage
$292,000
Interest Rate
5%
Mortgage Type
Purchase Money Mortgage
Purchase Details
Closed on
Feb 28, 2005
Sold by
Lemus Catherine
Bought by
Souleiman Aida
Home Financials for this Owner
Home Financials are based on the most recent Mortgage that was taken out on this home.
Original Mortgage
$292,000
Interest Rate
5%
Mortgage Type
Purchase Money Mortgage
Purchase Details
Closed on
May 6, 2002
Sold by
Green Heather
Bought by
Green Soctt Edward and Green Scott Edward
Home Financials for this Owner
Home Financials are based on the most recent Mortgage that was taken out on this home.
Original Mortgage
$170,537
Interest Rate
7.13%
Mortgage Type
Stand Alone First
Purchase Details
Closed on
Apr 1, 2002
Sold by
Green Scott Edward
Bought by
Lemus Catherine
Home Financials for this Owner
Home Financials are based on the most recent Mortgage that was taken out on this home.
Original Mortgage
$170,537
Interest Rate
7.13%
Mortgage Type
Stand Alone First
Purchase Details
Closed on
Aug 17, 1994
Sold by
Hardy Bart and Young Jill A
Bought by
Green Scott Edward
Home Financials for this Owner
Home Financials are based on the most recent Mortgage that was taken out on this home.
Original Mortgage
$89,300
Interest Rate
7.12%
Create a Home Valuation Report for This Property
The Home Valuation Report is an in-depth analysis detailing your home's value as well as a comparison with similar homes in the area
Home Values in the Area
Average Home Value in this Area
Purchase History
| Date | Buyer | Sale Price | Title Company |
|---|---|---|---|
| Veneman Holly | $219,000 | Lawyers Title Company | |
| Affordable Housing Clearinghouse | $208,500 | Ticor Title | |
| Federal Home Loan Mortgage Corporation | $237,900 | Accommodation | |
| Lemus Catherine | -- | Orange Coast Title | |
| Souleiman Aida | $368,000 | Orange Coast Title | |
| Green Soctt Edward | -- | Southland Title Corporation | |
| Lemus Catherine | $195,000 | Southland Title Corporation | |
| Green Scott Edward | $94,000 | North American Title Co |
Source: Public Records
Mortgage History
| Date | Status | Borrower | Loan Amount |
|---|---|---|---|
| Open | Veneman Holly | $39,335 | |
| Previous Owner | Veneman Holly | $159,665 | |
| Previous Owner | Affordable Housing Clearinghouse | $193,230 | |
| Previous Owner | Souleiman Aida | $292,000 | |
| Previous Owner | Lemus Catherine | $170,537 | |
| Previous Owner | Green Scott Edward | $89,300 | |
| Closed | Lemus Catherine | $38,980 | |
| Closed | Souleiman Aida | $76,000 |
Source: Public Records
Tax History Compared to Growth
Tax History
| Year | Tax Paid | Tax Assessment Tax Assessment Total Assessment is a certain percentage of the fair market value that is determined by local assessors to be the total taxable value of land and additions on the property. | Land | Improvement |
|---|---|---|---|---|
| 2025 | $2,749 | $275,071 | $156,443 | $118,628 |
| 2024 | $2,749 | $269,678 | $153,376 | $116,302 |
| 2023 | $2,685 | $264,391 | $150,369 | $114,022 |
| 2022 | $2,638 | $259,207 | $147,420 | $111,787 |
| 2021 | $2,139 | $254,125 | $144,529 | $109,596 |
| 2020 | $2,565 | $251,520 | $143,047 | $108,473 |
| 2019 | $2,802 | $246,589 | $140,242 | $106,347 |
| 2018 | $2,759 | $241,754 | $137,492 | $104,262 |
| 2017 | $2,779 | $237,014 | $134,796 | $102,218 |
| 2016 | $3,050 | $232,367 | $132,153 | $100,214 |
| 2015 | $3,146 | $228,877 | $130,168 | $98,709 |
| 2014 | $3,089 | $224,394 | $127,618 | $96,776 |
Source: Public Records
Map
Nearby Homes
- 34 Dianthus
- 21 Lobelia
- 19 Vista Barranca Unit 75
- 3 Vista Mesa Unit 44
- 23 Vista Colinas
- 27 Calle Melinda
- 7 Santolina
- 31 Brisa Del Lago
- 1 Brisa Del Lago
- 7 Via Tortuga
- 231 Montana Del Lago Dr Unit 22
- 250 Montana Del Lago Dr
- 25 Dewberry
- 29 Carnation Unit 64
- 18 Via Felicia
- 16 Las Piedras
- 73 Gaviota
- 34 Rosa Unit 3
- 31 Gaviota Unit 136
- 54 Gavilan