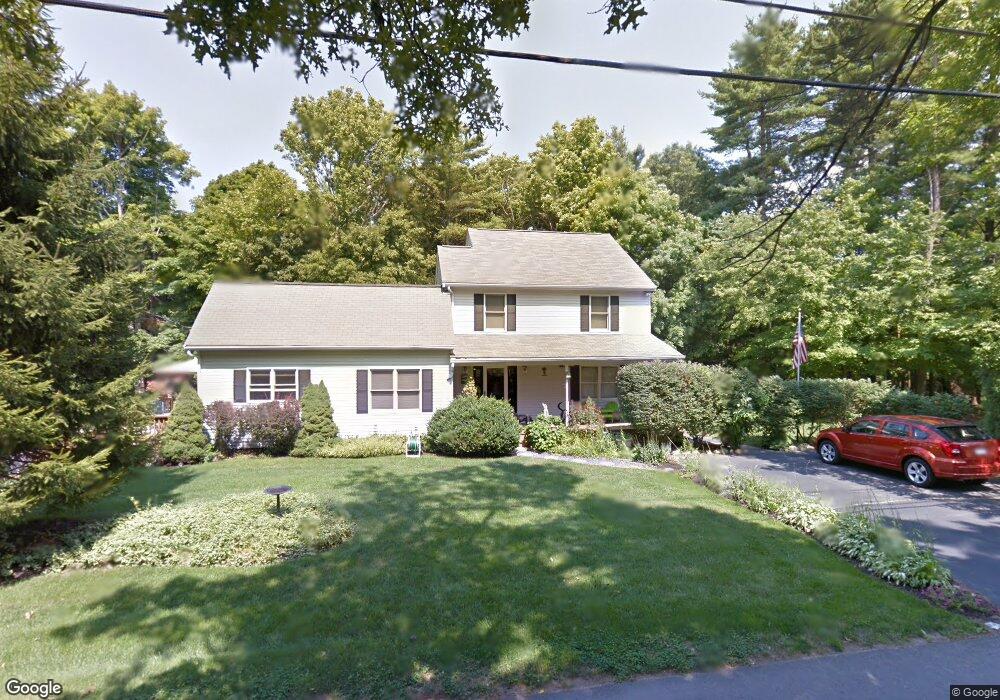
66 N High St Foxboro, MA 02035
Estimated Value: $738,000 - $843,000
3
Beds
3
Baths
2,274
Sq Ft
$339/Sq Ft
Est. Value
About This Home
This home is located at 66 N High St, Foxboro, MA 02035 and is currently estimated at $771,703, approximately $339 per square foot. 66 N High St is a home located in Norfolk County with nearby schools including Foxborough High School, Foxborough Regional Charter School, and Hands-On-Montessori School.
Ownership History
Date
Name
Owned For
Owner Type
Purchase Details
Closed on
Mar 2, 2022
Sold by
Salomaa Robert H
Bought by
Salomaa Kathleen M
Current Estimated Value
Home Financials for this Owner
Home Financials are based on the most recent Mortgage that was taken out on this home.
Original Mortgage
$400,000
Outstanding Balance
$372,747
Interest Rate
3.69%
Mortgage Type
Stand Alone Refi Refinance Of Original Loan
Estimated Equity
$398,956
Purchase Details
Closed on
Dec 14, 1989
Sold by
Wheeler Ernest C
Bought by
Salomaa Robert H
Create a Home Valuation Report for This Property
The Home Valuation Report is an in-depth analysis detailing your home's value as well as a comparison with similar homes in the area
Home Values in the Area
Average Home Value in this Area
Purchase History
| Date | Buyer | Sale Price | Title Company |
|---|---|---|---|
| Salomaa Kathleen M | -- | None Available | |
| Salomaa Kathleen M | -- | None Available | |
| Salomaa Robert H | $103,000 | -- |
Source: Public Records
Mortgage History
| Date | Status | Borrower | Loan Amount |
|---|---|---|---|
| Open | Salomaa Kathleen M | $400,000 | |
| Closed | Salomaa Kathleen M | $400,000 | |
| Previous Owner | Salomaa Robert H | $244,000 | |
| Previous Owner | Salomaa Robert H | $227,000 |
Source: Public Records
Tax History Compared to Growth
Tax History
| Year | Tax Paid | Tax Assessment Tax Assessment Total Assessment is a certain percentage of the fair market value that is determined by local assessors to be the total taxable value of land and additions on the property. | Land | Improvement |
|---|---|---|---|---|
| 2025 | $7,806 | $590,500 | $263,100 | $327,400 |
| 2024 | $7,833 | $579,800 | $263,000 | $316,800 |
| 2023 | $7,565 | $532,400 | $250,600 | $281,800 |
| 2022 | $7,318 | $504,000 | $239,900 | $264,100 |
| 2021 | $7,043 | $477,800 | $218,200 | $259,600 |
| 2020 | $6,832 | $468,900 | $218,200 | $250,700 |
| 2019 | $6,477 | $440,600 | $207,800 | $232,800 |
| 2018 | $6,085 | $433,900 | $207,800 | $226,100 |
| 2017 | $6,085 | $404,600 | $194,200 | $210,400 |
| 2016 | $5,666 | $382,300 | $187,100 | $195,200 |
| 2015 | $5,525 | $363,700 | $158,100 | $205,600 |
| 2014 | $5,636 | $376,000 | $155,000 | $221,000 |
Source: Public Records
Map
Nearby Homes
- 356 Central St
- 12 Spring St
- 277 Central St
- 450 West St
- 11 W Belcher Rd Unit 2
- 80 Mill St
- 166 Chauncy St
- 406 South St
- 18 Winter St Unit E
- 14 Winter St Unit B
- 28 Angell St
- 84 Cocasset St Unit A6
- 44 Angell St Unit 44
- 619 N Main St
- 24 Mechanic St
- 14 Baker St
- 22 Pleasant St Unit C
- 11 Orchard Place Unit 11
- 82 Brook St
- 28 Court St