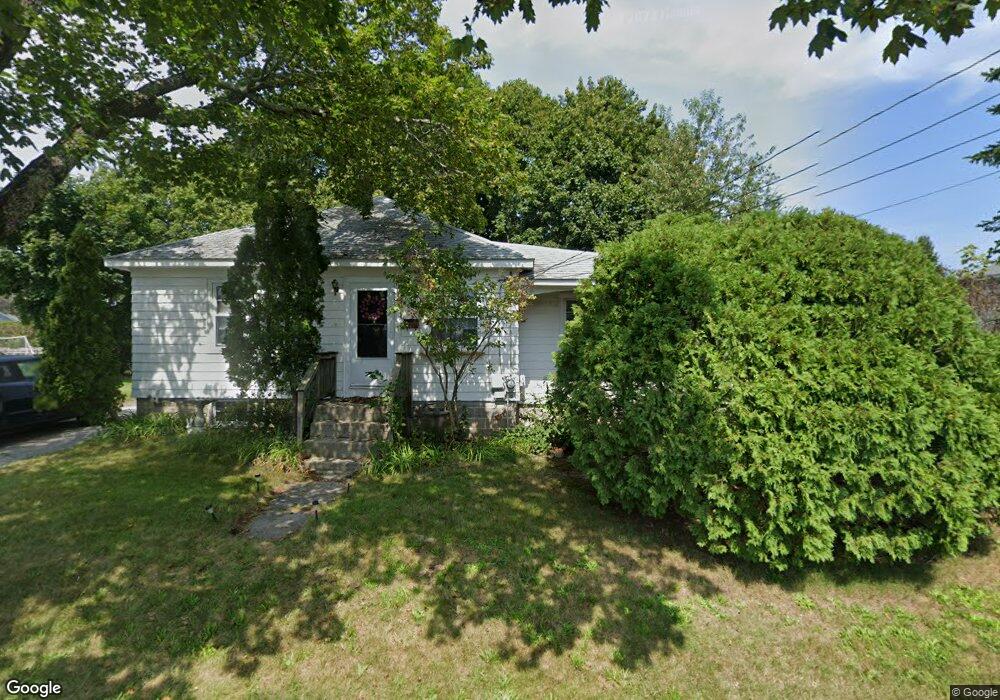
66 Roffee St Barrington, RI 02806
North Barrington NeighborhoodEstimated Value: $454,426 - $571,000
3
Beds
1
Bath
1,114
Sq Ft
$459/Sq Ft
Est. Value
About This Home
This home is located at 66 Roffee St, Barrington, RI 02806 and is currently estimated at $510,857, approximately $458 per square foot. 66 Roffee St is a home located in Bristol County with nearby schools including Barrington High School, St Luke Elementary School, and Barrington Christian Academy.
Ownership History
Date
Name
Owned For
Owner Type
Purchase Details
Closed on
Mar 18, 2022
Sold by
Coury Kenneth S and Malozzi Debra A
Bought by
Teixeira Shenelle C
Current Estimated Value
Home Financials for this Owner
Home Financials are based on the most recent Mortgage that was taken out on this home.
Original Mortgage
$288,000
Outstanding Balance
$268,378
Interest Rate
3.69%
Mortgage Type
Stand Alone Refi Refinance Of Original Loan
Estimated Equity
$242,479
Purchase Details
Closed on
Dec 16, 2020
Sold by
Coury Frances
Bought by
Coury Kenneth S and Malozzi Debra A
Create a Home Valuation Report for This Property
The Home Valuation Report is an in-depth analysis detailing your home's value as well as a comparison with similar homes in the area
Home Values in the Area
Average Home Value in this Area
Purchase History
| Date | Buyer | Sale Price | Title Company |
|---|---|---|---|
| Teixeira Shenelle C | -- | None Available | |
| Teixeira Shenelle C | -- | None Available | |
| Coury Kenneth S | -- | None Available | |
| Coury Kenneth S | -- | None Available |
Source: Public Records
Mortgage History
| Date | Status | Borrower | Loan Amount |
|---|---|---|---|
| Open | Teixeira Shenelle C | $288,000 | |
| Closed | Teixeira Shenelle C | $288,000 |
Source: Public Records
Tax History Compared to Growth
Tax History
| Year | Tax Paid | Tax Assessment Tax Assessment Total Assessment is a certain percentage of the fair market value that is determined by local assessors to be the total taxable value of land and additions on the property. | Land | Improvement |
|---|---|---|---|---|
| 2025 | $5,062 | $330,000 | $229,000 | $101,000 |
| 2024 | $4,868 | $330,000 | $229,000 | $101,000 |
| 2023 | $4,365 | $215,000 | $131,000 | $84,000 |
| 2022 | $4,225 | $215,000 | $131,000 | $84,000 |
| 2021 | $4,117 | $215,000 | $131,000 | $84,000 |
| 2020 | $3,887 | $186,000 | $108,000 | $78,000 |
| 2019 | $3,739 | $186,000 | $108,000 | $78,000 |
| 2018 | $3,627 | $186,000 | $108,000 | $78,000 |
| 2017 | $3,776 | $188,800 | $102,100 | $86,700 |
| 2016 | $3,483 | $188,800 | $102,100 | $86,700 |
| 2015 | $3,446 | $188,800 | $102,100 | $86,700 |
| 2014 | $3,521 | $192,400 | $102,100 | $90,300 |
Source: Public Records
Map
Nearby Homes