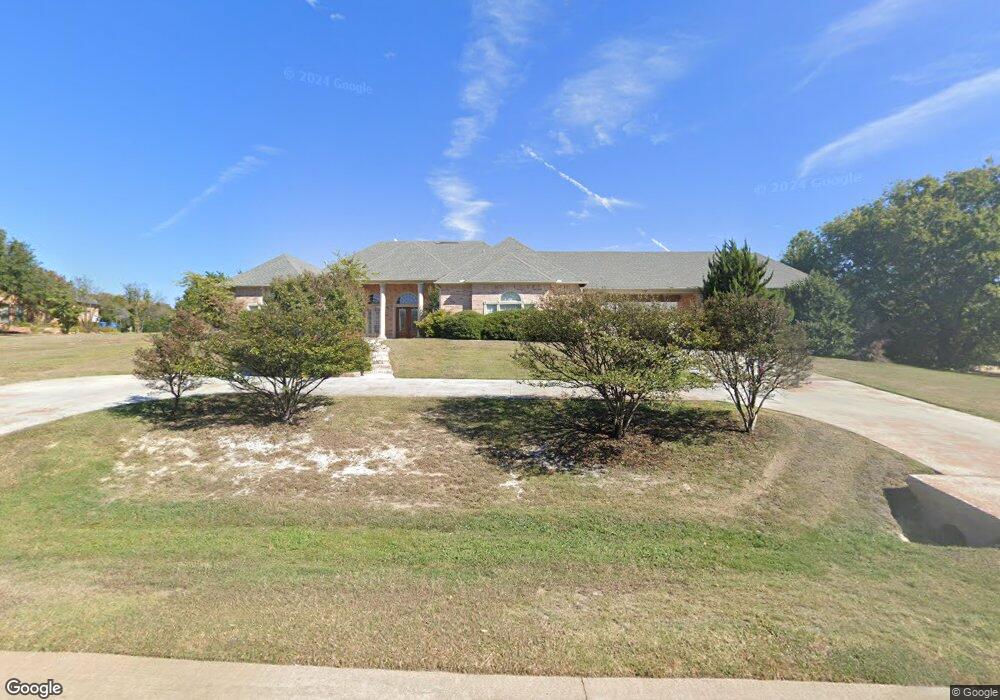
660 Oakmont Ct McKinney, TX 75069
Estimated Value: $1,182,000 - $1,601,000
4
Beds
5
Baths
3,953
Sq Ft
$332/Sq Ft
Est. Value
About This Home
This home is located at 660 Oakmont Ct, McKinney, TX 75069 and is currently estimated at $1,312,864, approximately $332 per square foot. 660 Oakmont Ct is a home located in Collin County with nearby schools including Robert L Puster Elementary School, Sloan Creek Intermediate School, and Willow Springs Middle School.
Ownership History
Date
Name
Owned For
Owner Type
Purchase Details
Closed on
Jun 11, 2010
Sold by
The Bank Of New York Mellon
Bought by
Wise Robert
Current Estimated Value
Purchase Details
Closed on
Feb 8, 2010
Sold by
Facey John K and Facey Yvonne A
Bought by
The Bank Of New York Mellon and The Bank Of New York
Purchase Details
Closed on
Sep 17, 2001
Sold by
Parthenon Development Inc
Bought by
Facey John K and Facey Yvonne A
Home Financials for this Owner
Home Financials are based on the most recent Mortgage that was taken out on this home.
Original Mortgage
$465,450
Interest Rate
6.88%
Purchase Details
Closed on
Sep 29, 2000
Sold by
Mark Collins Builders Inc
Bought by
Dennison Gregory J and Dennison Ginger L
Home Financials for this Owner
Home Financials are based on the most recent Mortgage that was taken out on this home.
Original Mortgage
$85,500
Interest Rate
7.96%
Create a Home Valuation Report for This Property
The Home Valuation Report is an in-depth analysis detailing your home's value as well as a comparison with similar homes in the area
Home Values in the Area
Average Home Value in this Area
Purchase History
| Date | Buyer | Sale Price | Title Company |
|---|---|---|---|
| Wise Robert | -- | Old Republic National Title | |
| The Bank Of New York Mellon | $425,000 | None Available | |
| Facey John K | -- | -- | |
| Parthenon Development Inc | -- | -- | |
| Dennison Gregory J | -- | -- |
Source: Public Records
Mortgage History
| Date | Status | Borrower | Loan Amount |
|---|---|---|---|
| Previous Owner | Facey John K | $465,450 | |
| Previous Owner | Dennison Gregory J | $85,500 |
Source: Public Records
Tax History Compared to Growth
Tax History
| Year | Tax Paid | Tax Assessment Tax Assessment Total Assessment is a certain percentage of the fair market value that is determined by local assessors to be the total taxable value of land and additions on the property. | Land | Improvement |
|---|---|---|---|---|
| 2025 | $8,280 | $986,068 | $350,350 | $922,536 |
| 2024 | $8,280 | $896,425 | $310,310 | $896,503 |
| 2023 | $8,280 | $814,932 | $285,285 | $766,133 |
| 2022 | $15,038 | $740,847 | $225,225 | $605,986 |
| 2021 | $14,143 | $673,497 | $225,225 | $448,272 |
| 2020 | $13,799 | $635,422 | $225,225 | $410,197 |
| 2019 | $15,424 | $675,963 | $225,225 | $474,138 |
| 2018 | $14,146 | $614,512 | $175,175 | $439,337 |
| 2017 | $13,513 | $587,000 | $145,145 | $441,855 |
| 2016 | $12,578 | $542,241 | $145,145 | $397,096 |
| 2015 | $11,867 | $532,731 | $145,145 | $387,586 |
Source: Public Records
Map
Nearby Homes
- 370 Oakwood Trail
- 460 Collinwood Dr
- 1910 Saint Johns Ave
- 871 Timberwood Ln
- 1923 Armstrong Dr
- 1908 Bordeaux Ct
- 258 Britton Ct
- 211 Britton Ct
- 228 Britton Ct
- 501 Cottonwood Place
- 950 Foxdale
- 480 Oakwood Cir
- 620 Redwood Creek Dr
- 1717 Monaco Dr
- 701 Meandering Way
- 1000 Country Trail
- 811 Shady Brook Ln
- 2017 Country Brook Ln
- 1728 River Oaks Dr
- 1191 Harper Landing