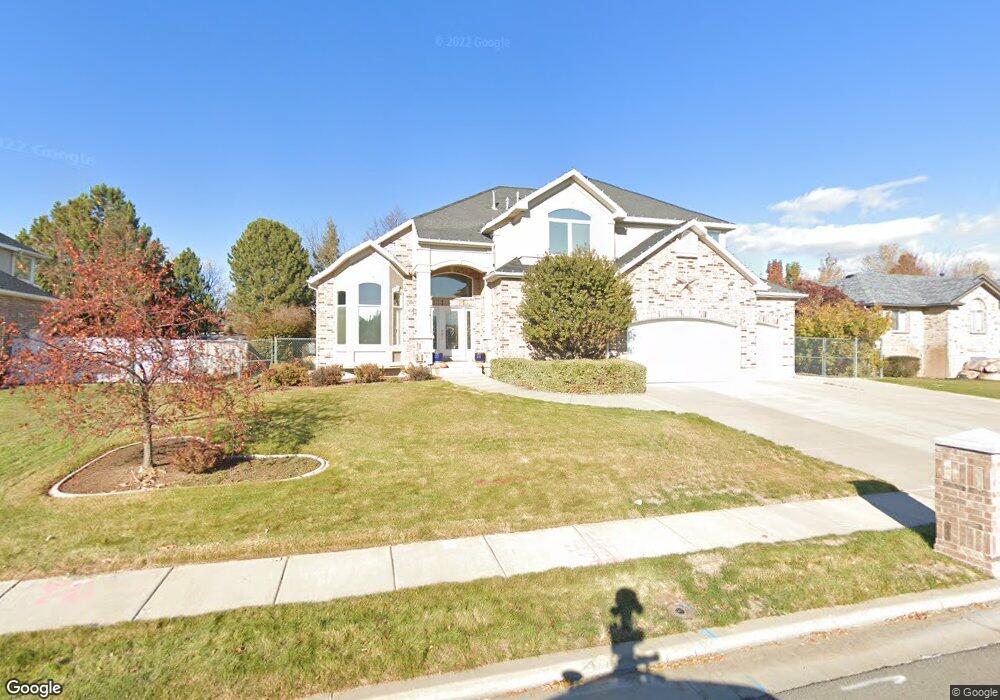
660 W 2300 S Syracuse, UT 84075
Estimated Value: $733,002 - $764,000
4
Beds
3
Baths
4,634
Sq Ft
$162/Sq Ft
Est. Value
About This Home
This home is located at 660 W 2300 S, Syracuse, UT 84075 and is currently estimated at $749,251, approximately $161 per square foot. 660 W 2300 S is a home located in Davis County with nearby schools including Bluff Ridge Elementary, Legacy Junior High School, and Clearfield High School.
Ownership History
Date
Name
Owned For
Owner Type
Purchase Details
Closed on
Jul 30, 2014
Sold by
Mattingley Gale D and Mattingley Diane C
Bought by
Decaria Scott and Decaria Samila
Current Estimated Value
Home Financials for this Owner
Home Financials are based on the most recent Mortgage that was taken out on this home.
Original Mortgage
$307,000
Outstanding Balance
$233,579
Interest Rate
4.13%
Mortgage Type
New Conventional
Estimated Equity
$515,672
Purchase Details
Closed on
Jul 31, 2009
Sold by
The Mattingley Family Trust and Mattingley Gale D
Bought by
Mattingley Gale D and Mattingley Diane C
Home Financials for this Owner
Home Financials are based on the most recent Mortgage that was taken out on this home.
Original Mortgage
$233,150
Interest Rate
5.37%
Mortgage Type
New Conventional
Purchase Details
Closed on
May 18, 2005
Sold by
Mattingley Gale D and Mattingley Diane C
Bought by
Mattingley Gale D and Mattingley Diane C
Home Financials for this Owner
Home Financials are based on the most recent Mortgage that was taken out on this home.
Original Mortgage
$243,000
Interest Rate
5.87%
Mortgage Type
New Conventional
Purchase Details
Closed on
Aug 10, 2000
Sold by
Mattingley Gale D and Mattingley Diane C
Bought by
Mattingley Gale D and Mattingley Diane C
Home Financials for this Owner
Home Financials are based on the most recent Mortgage that was taken out on this home.
Original Mortgage
$37,500
Interest Rate
8.19%
Mortgage Type
Credit Line Revolving
Purchase Details
Closed on
Jul 7, 1999
Sold by
Mattingley Gale D and Mattingley Diane C
Bought by
Mattingley Gale D and Mattingley Diane C
Home Financials for this Owner
Home Financials are based on the most recent Mortgage that was taken out on this home.
Original Mortgage
$210,800
Interest Rate
7%
Purchase Details
Closed on
Jun 22, 1999
Sold by
Scott Baker Construction Inc
Bought by
Scott Baker Construction Inc
Home Financials for this Owner
Home Financials are based on the most recent Mortgage that was taken out on this home.
Original Mortgage
$210,800
Interest Rate
7%
Purchase Details
Closed on
Aug 26, 1998
Sold by
T B E Investments Llc
Bought by
Build Tech Inc
Create a Home Valuation Report for This Property
The Home Valuation Report is an in-depth analysis detailing your home's value as well as a comparison with similar homes in the area
Home Values in the Area
Average Home Value in this Area
Purchase History
| Date | Buyer | Sale Price | Title Company |
|---|---|---|---|
| Decaria Scott | -- | Cottonwood Title | |
| Mattingley Gale D | -- | Mountain View Title | |
| Mattingley Gale D | -- | Heritage West Title Ins Agen | |
| Mattingley Gale D | -- | Heritage West Title Ins Agen | |
| Mattingley Gale D | -- | Mountain View Title & Escrow | |
| Mattingley Gale D | -- | Mountain View Title & Escrow | |
| Mattingley Gale D | -- | Mountain View Title & Escrow | |
| Mattingley Gale D | -- | Mountain View Title & Escrow | |
| Scott Baker Construction Inc | -- | Bonneville Title Company Inc | |
| Build Tech Inc | -- | Bonneville Title Company Inc |
Source: Public Records
Mortgage History
| Date | Status | Borrower | Loan Amount |
|---|---|---|---|
| Open | Decaria Scott | $307,000 | |
| Previous Owner | Mattingley Gale D | $233,150 | |
| Previous Owner | Mattingley Gale D | $243,000 | |
| Previous Owner | Mattingley Gale D | $37,500 | |
| Previous Owner | Mattingley Gale D | $210,800 |
Source: Public Records
Tax History Compared to Growth
Tax History
| Year | Tax Paid | Tax Assessment Tax Assessment Total Assessment is a certain percentage of the fair market value that is determined by local assessors to be the total taxable value of land and additions on the property. | Land | Improvement |
|---|---|---|---|---|
| 2025 | $3,820 | $368,500 | $128,486 | $240,014 |
| 2024 | $3,590 | $348,700 | $109,715 | $238,985 |
| 2023 | $3,407 | $603,000 | $152,674 | $450,326 |
| 2022 | $3,565 | $345,950 | $87,406 | $258,544 |
| 2021 | $3,156 | $474,000 | $129,562 | $344,438 |
| 2020 | $2,868 | $417,000 | $111,124 | $305,876 |
| 2019 | $2,758 | $396,000 | $110,748 | $285,252 |
| 2018 | $2,800 | $399,000 | $105,810 | $293,190 |
| 2016 | $2,483 | $185,515 | $40,534 | $144,981 |
| 2015 | $2,549 | $181,390 | $40,534 | $140,856 |
| 2014 | $2,514 | $182,334 | $40,534 | $141,800 |
| 2013 | -- | $163,195 | $38,525 | $124,670 |
Source: Public Records
Map
Nearby Homes