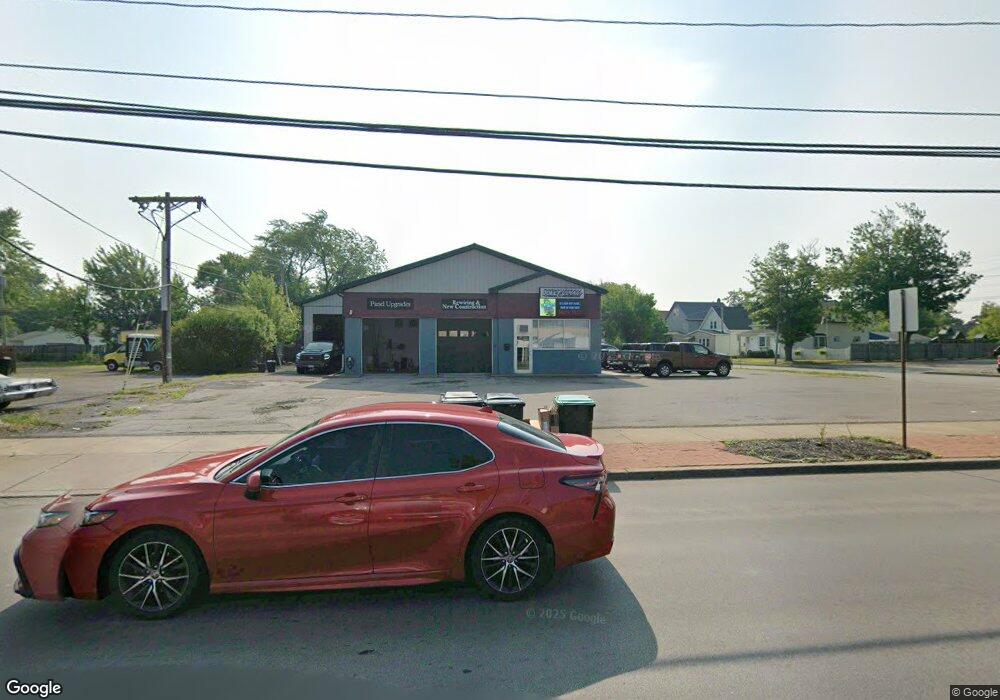
661 Main St Tonawanda, NY 14150
Estimated Value: $284,282
--
Bed
--
Bath
1,260
Sq Ft
$226/Sq Ft
Est. Value
About This Home
This home is located at 661 Main St, Tonawanda, NY 14150 and is currently estimated at $284,282, approximately $225 per square foot. 661 Main St is a home located in Erie County with nearby schools including Mullen Elementary School, Tonawanda Elementary School, and Tonawanda Middle High School.
Ownership History
Date
Name
Owned For
Owner Type
Purchase Details
Closed on
Apr 29, 2019
Sold by
Harbi & Sons Inc
Bought by
661 Main Llc
Current Estimated Value
Purchase Details
Closed on
Mar 6, 2018
Sold by
Calway Terence
Bought by
Harbi & Sons Inc
Home Financials for this Owner
Home Financials are based on the most recent Mortgage that was taken out on this home.
Original Mortgage
$6,000
Interest Rate
4.15%
Mortgage Type
New Conventional
Purchase Details
Closed on
Aug 28, 2009
Sold by
Glw Enterprises Of Wny Inc
Bought by
Calway Terence
Home Financials for this Owner
Home Financials are based on the most recent Mortgage that was taken out on this home.
Original Mortgage
$50,000
Interest Rate
4.77%
Mortgage Type
Commercial
Create a Home Valuation Report for This Property
The Home Valuation Report is an in-depth analysis detailing your home's value as well as a comparison with similar homes in the area
Home Values in the Area
Average Home Value in this Area
Purchase History
| Date | Buyer | Sale Price | Title Company |
|---|---|---|---|
| 661 Main Llc | $150,000 | Eastern Abstract Of Ny Inc | |
| Harbi & Sons Inc | $110,000 | None Available | |
| Calway Terence | $85,000 | None Available |
Source: Public Records
Mortgage History
| Date | Status | Borrower | Loan Amount |
|---|---|---|---|
| Previous Owner | Harbi & Sons Inc | $6,000 | |
| Previous Owner | Calway Terence | $50,000 |
Source: Public Records
Tax History Compared to Growth
Tax History
| Year | Tax Paid | Tax Assessment Tax Assessment Total Assessment is a certain percentage of the fair market value that is determined by local assessors to be the total taxable value of land and additions on the property. | Land | Improvement |
|---|---|---|---|---|
| 2024 | $2,418 | $160,000 | $54,800 | $105,200 |
| 2023 | $2,314 | $160,000 | $54,800 | $105,200 |
| 2022 | $2,199 | $105,000 | $44,400 | $60,600 |
| 2021 | $1,772 | $80,000 | $44,400 | $35,600 |
| 2020 | $1,752 | $80,000 | $44,400 | $35,600 |
| 2019 | $3,265 | $80,000 | $44,400 | $35,600 |
| 2018 | $1,707 | $80,000 | $44,400 | $35,600 |
| 2017 | $484 | $80,000 | $44,400 | $35,600 |
| 2016 | $1,883 | $80,000 | $44,400 | $35,600 |
| 2015 | -- | $80,000 | $44,400 | $35,600 |
| 2014 | -- | $80,000 | $44,400 | $35,600 |
Source: Public Records
Map
Nearby Homes