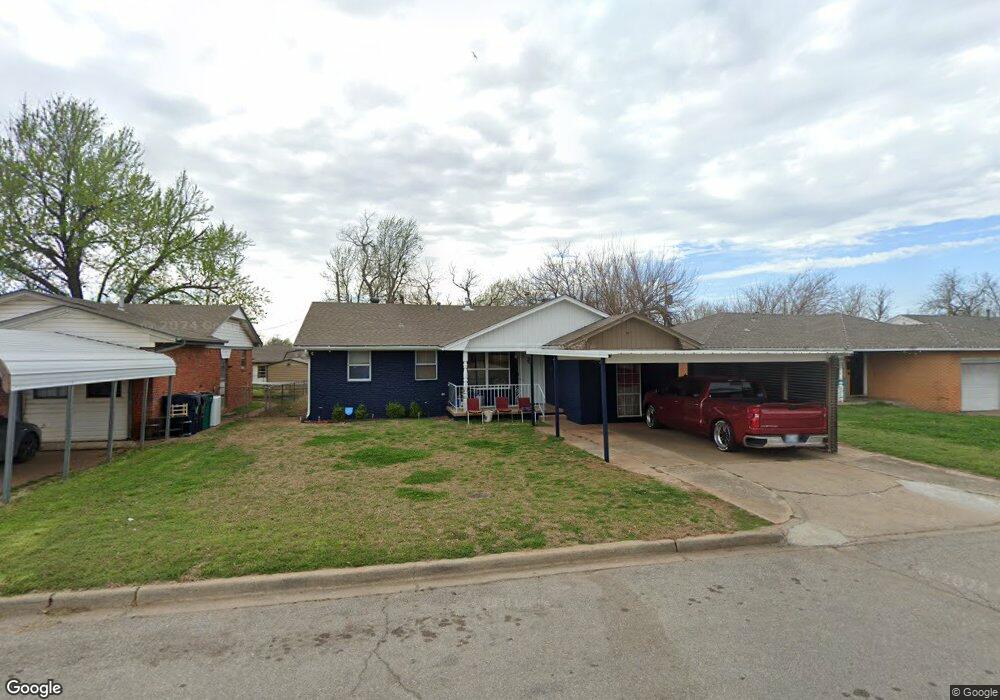
6617 Johnnie Terrace Oklahoma City, OK 73149
Cloverleaf NeighborhoodEstimated Value: $96,000 - $104,423
3
Beds
1
Bath
853
Sq Ft
$120/Sq Ft
Est. Value
About This Home
This home is located at 6617 Johnnie Terrace, Oklahoma City, OK 73149 and is currently estimated at $102,106, approximately $119 per square foot. 6617 Johnnie Terrace is a home located in Oklahoma County with nearby schools including Hayes Elementary School, Webster Middle School, and Capitol Hill High School.
Ownership History
Date
Name
Owned For
Owner Type
Purchase Details
Closed on
Oct 29, 2020
Sold by
Montoya Martin J and Montoya Tashina
Bought by
Cruz Maria E and Gomez Johni Cruz
Current Estimated Value
Home Financials for this Owner
Home Financials are based on the most recent Mortgage that was taken out on this home.
Original Mortgage
$61,750
Outstanding Balance
$54,949
Interest Rate
2.8%
Mortgage Type
New Conventional
Estimated Equity
$47,157
Purchase Details
Closed on
Apr 18, 2011
Sold by
Hopkins Chandra L and Hopkins Billy
Bought by
Montoya Martin J
Home Financials for this Owner
Home Financials are based on the most recent Mortgage that was taken out on this home.
Original Mortgage
$59,716
Interest Rate
4.87%
Mortgage Type
FHA
Purchase Details
Closed on
Feb 26, 2004
Sold by
Miller Robert L and Miller Phyllis J
Bought by
Hopkins Chandra L
Purchase Details
Closed on
Aug 1, 1996
Sold by
Scrivner Fred L
Bought by
Miller Robert L and Miller Phyllis J
Create a Home Valuation Report for This Property
The Home Valuation Report is an in-depth analysis detailing your home's value as well as a comparison with similar homes in the area
Home Values in the Area
Average Home Value in this Area
Purchase History
| Date | Buyer | Sale Price | Title Company |
|---|---|---|---|
| Cruz Maria E | $65,000 | Oklahoma City Abstract & Ttl | |
| Montoya Martin J | $61,500 | Capitol Abstract & Title Co | |
| Hopkins Chandra L | $50,000 | American Guaranty Title Co | |
| Miller Robert L | $500 | -- |
Source: Public Records
Mortgage History
| Date | Status | Borrower | Loan Amount |
|---|---|---|---|
| Open | Cruz Maria E | $61,750 | |
| Previous Owner | Montoya Martin J | $59,716 |
Source: Public Records
Tax History Compared to Growth
Tax History
| Year | Tax Paid | Tax Assessment Tax Assessment Total Assessment is a certain percentage of the fair market value that is determined by local assessors to be the total taxable value of land and additions on the property. | Land | Improvement |
|---|---|---|---|---|
| 2024 | $754 | $7,591 | $766 | $6,825 |
| 2023 | $754 | $7,370 | $1,282 | $6,088 |
| 2022 | $718 | $7,370 | $1,105 | $6,265 |
| 2021 | $828 | $7,370 | $1,105 | $6,265 |
| 2020 | $785 | $6,930 | $1,105 | $5,825 |
| 2019 | $755 | $6,688 | $1,058 | $5,630 |
| 2018 | $697 | $6,160 | $0 | $0 |
| 2017 | $686 | $6,063 | $999 | $5,064 |
| 2016 | $654 | $5,774 | $1,006 | $4,768 |
| 2015 | $662 | $5,789 | $1,006 | $4,783 |
| 2014 | $735 | $6,469 | $1,115 | $5,354 |
Source: Public Records
Map
Nearby Homes
- 6517 S Phillips Ave
- 6417 Ashby Terrace
- 837 SE 68th St
- 705 SE 62nd St
- 6133 Courtyards Ct
- 6140 Cielo Terrace
- 704 SE 60th Terrace
- 329 SE 58th St
- 6800 S I- 35 Service Rd
- 312 SE 55th St
- 1505 SE 65th St
- 7028 S Harvey Ave
- 7033 S Harvey Ave
- 301 SE 54th St
- 5502 S Shields Blvd
- 201 SW 66th St
- 1605 SE 62nd St
- 1607 SE 62nd St
- 1619 SE 63rd St
- 6508 S Harvey Ave
- 6613 Johnnie Terrace
- 6621 Johnnie Terrace
- 6609 Johnnie Terrace
- 6616 Ashby Terrace
- 6612 Ashby Terrace
- 6620 Ashby Terrace
- 6608 Ashby Terrace
- 6605 Johnnie Terrace
- 6612 Johnnie Terrace
- 6620 Johnnie Terrace
- 6701 Johnnie Terrace
- 6608 Johnnie Terrace
- 6604 Ashby Terrace
- 6601 Johnnie Terrace
- 6604 Johnnie Terrace
- 6700 Ashby Terrace
- 6705 Johnnie Terrace
- 6600 Ashby Terrace
- 6708 Ashby Terrace
- 6700 Johnnie Terrace