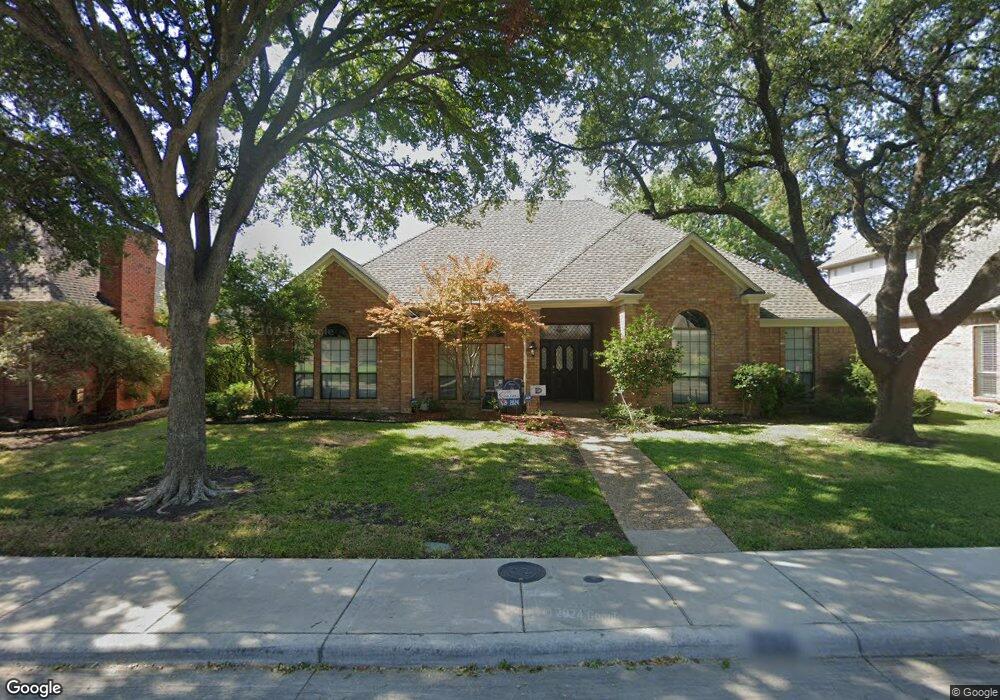
6638 Mimms Dr Dallas, TX 75252
Far North Dallas NeighborhoodEstimated Value: $624,661 - $745,000
4
Beds
3
Baths
2,577
Sq Ft
$264/Sq Ft
Est. Value
About This Home
This home is located at 6638 Mimms Dr, Dallas, TX 75252 and is currently estimated at $679,665, approximately $263 per square foot. 6638 Mimms Dr is a home located in Collin County with nearby schools including Jackson Elementary School, Frankford Middle, and Shepton High School.
Ownership History
Date
Name
Owned For
Owner Type
Purchase Details
Closed on
Mar 11, 2011
Sold by
Ganus Christopher L and Ganus Lucianna C
Bought by
Afopa Wilfried R and Afopa Karine S
Current Estimated Value
Home Financials for this Owner
Home Financials are based on the most recent Mortgage that was taken out on this home.
Original Mortgage
$231,900
Outstanding Balance
$159,263
Interest Rate
4.78%
Mortgage Type
New Conventional
Estimated Equity
$520,402
Purchase Details
Closed on
May 19, 2005
Sold by
Hardy Cynthia L and Smith Cynthia H
Bought by
Ganus Christopher L and Ganus Lucianna C
Home Financials for this Owner
Home Financials are based on the most recent Mortgage that was taken out on this home.
Original Mortgage
$212,000
Interest Rate
5.92%
Mortgage Type
Fannie Mae Freddie Mac
Purchase Details
Closed on
Feb 23, 2001
Sold by
Hayman Jimmy N and Hayman Joetta D
Bought by
Hardy Cynthia L
Home Financials for this Owner
Home Financials are based on the most recent Mortgage that was taken out on this home.
Original Mortgage
$188,000
Interest Rate
6.85%
Create a Home Valuation Report for This Property
The Home Valuation Report is an in-depth analysis detailing your home's value as well as a comparison with similar homes in the area
Home Values in the Area
Average Home Value in this Area
Purchase History
| Date | Buyer | Sale Price | Title Company |
|---|---|---|---|
| Afopa Wilfried R | -- | Rtt | |
| Ganus Christopher L | -- | Rtt | |
| Hardy Cynthia L | -- | -- |
Source: Public Records
Mortgage History
| Date | Status | Borrower | Loan Amount |
|---|---|---|---|
| Open | Afopa Wilfried R | $231,900 | |
| Previous Owner | Ganus Christopher L | $212,000 | |
| Previous Owner | Hardy Cynthia L | $188,000 | |
| Closed | Hardy Cynthia L | $35,250 |
Source: Public Records
Tax History Compared to Growth
Tax History
| Year | Tax Paid | Tax Assessment Tax Assessment Total Assessment is a certain percentage of the fair market value that is determined by local assessors to be the total taxable value of land and additions on the property. | Land | Improvement |
|---|---|---|---|---|
| 2025 | $8,757 | $598,760 | $215,000 | $455,346 |
| 2024 | $8,757 | $544,327 | $200,000 | $386,511 |
| 2023 | $8,757 | $494,843 | $180,000 | $416,721 |
| 2022 | $10,073 | $449,857 | $125,000 | $352,657 |
| 2021 | $9,583 | $408,961 | $105,000 | $303,961 |
| 2020 | $9,434 | $398,045 | $100,000 | $298,045 |
| 2019 | $10,155 | $409,840 | $110,000 | $299,840 |
| 2018 | $9,567 | $383,990 | $90,000 | $293,990 |
| 2017 | $9,519 | $388,141 | $80,000 | $308,141 |
| 2016 | $8,722 | $352,905 | $70,000 | $282,905 |
| 2015 | $5,432 | $315,768 | $70,000 | $245,768 |
Source: Public Records
Map
Nearby Homes
- 6703 Mimms Dr
- 6624 Missy Dr
- 18512 Featherwood Dr
- 6527 Genstar Ln
- 6724 Frankford Rd
- 6616 Gretchen Ln
- 6515 Genstar Ln
- 6604 Gretchen Ln
- 6512 Wrenwood Dr
- 7148 Elm Creek Ln
- 7006 Aspen Creek Ln
- 6415 Windsong Dr
- 7159 Pecan Creek Ln
- 18132 Meandering Way
- 7028 Mumford St
- 6507 Barfield Dr
- 7032 Halprin St
- 7032 Bremerton Dr
- 18512 Crownover Ct
- 7204 Debbe Dr
- 6634 Mimms Dr
- 6642 Mimms Dr
- 6639 Camille Ave
- 6643 Camille Ave
- 6630 Mimms Dr
- 6646 Mimms Dr
- 6635 Camille Ave
- 6639 Mimms Dr
- 6643 Mimms Dr
- 6635 Mimms Dr
- 6631 Camille Ave
- 18140 Peppy Place
- 6631 Mimms Dr
- 6647 Mimms Dr
- 6704 Mimms Dr
- 18272 Brighton Green
- 6628 Mimms Dr
- 18136 Peppy Place
- 6638 Camille Ave
- 6634 Dupper Dr