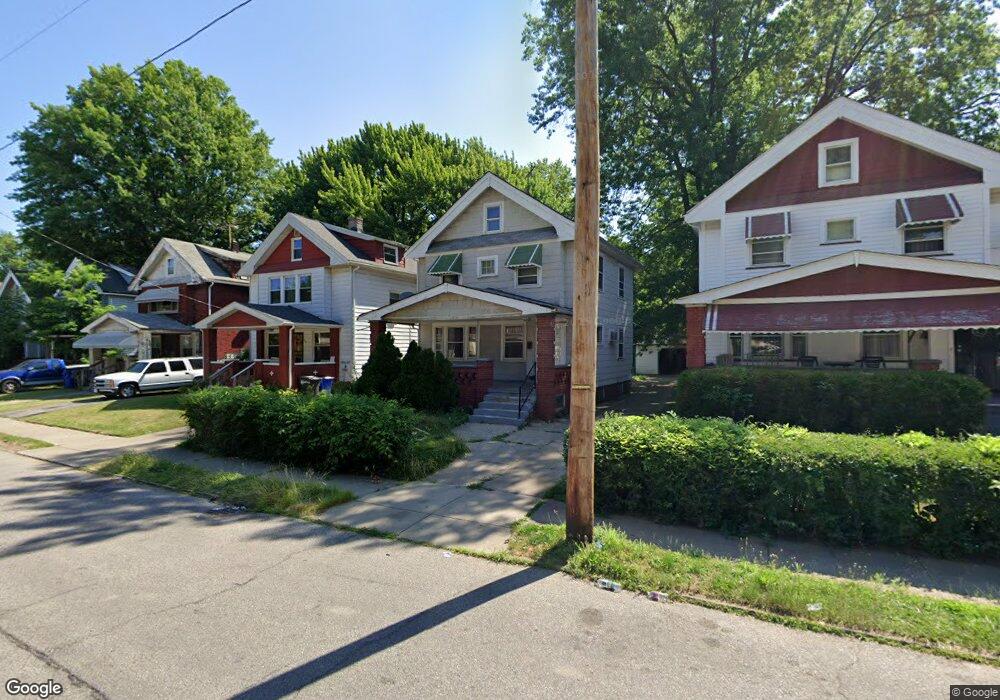
665 E 131st St Cleveland, OH 44108
Forest Hills NeighborhoodEstimated Value: $96,000 - $108,044
3
Beds
2
Baths
1,235
Sq Ft
$84/Sq Ft
Est. Value
About This Home
This home is located at 665 E 131st St, Cleveland, OH 44108 and is currently estimated at $103,761, approximately $84 per square foot. 665 E 131st St is a home located in Cuyahoga County with nearby schools including Bolton, Anton Grdina School, and Andrew J. Rickoff School.
Ownership History
Date
Name
Owned For
Owner Type
Purchase Details
Closed on
Apr 13, 2023
Sold by
Neopmg Llc
Bought by
Abbotsinch Rental Housing Spv Llc
Current Estimated Value
Purchase Details
Closed on
Jan 4, 2023
Sold by
Arable Investments Llc
Bought by
Neopmg Llc
Purchase Details
Closed on
May 26, 2022
Sold by
Patterson Orlando and Price Audroyce
Bought by
Arable Investments Llc
Purchase Details
Closed on
Nov 22, 2021
Sold by
Price Audroyce
Bought by
Patterson Orlando
Purchase Details
Closed on
Feb 3, 2009
Sold by
Citifinancial Inc
Bought by
Patterson Orlando
Purchase Details
Closed on
Jan 21, 2009
Sold by
Estate Of Lefonza Lee and Walker Karen
Bought by
Citifinancial Inc and City Loan Financial Services Inc
Purchase Details
Closed on
Sep 11, 1989
Sold by
Mcintyre Frank
Bought by
Lee Lefonza
Purchase Details
Closed on
Jun 28, 1989
Sold by
Mcintyre Frank C and Mcintyre Fannie B
Bought by
Mcintyre Frank
Purchase Details
Closed on
Jan 1, 1975
Bought by
Mcintyre Frank C and Mcintyre Fannie B
Create a Home Valuation Report for This Property
The Home Valuation Report is an in-depth analysis detailing your home's value as well as a comparison with similar homes in the area
Home Values in the Area
Average Home Value in this Area
Purchase History
| Date | Buyer | Sale Price | Title Company |
|---|---|---|---|
| Abbotsinch Rental Housing Spv Llc | $90,000 | None Listed On Document | |
| Neopmg Llc | $20,000 | American Patriot Title | |
| Arable Investments Llc | $27,100 | Chicago Title | |
| Patterson Orlando | -- | None Available | |
| Patterson Orlando | $8,500 | Chicago Title | |
| Citifinancial Inc | $14,000 | None Available | |
| Lee Lefonza | -- | -- | |
| Mcintyre Frank | -- | -- | |
| Mcintyre Frank | -- | -- | |
| Mcintyre Frank C | -- | -- |
Source: Public Records
Tax History Compared to Growth
Tax History
| Year | Tax Paid | Tax Assessment Tax Assessment Total Assessment is a certain percentage of the fair market value that is determined by local assessors to be the total taxable value of land and additions on the property. | Land | Improvement |
|---|---|---|---|---|
| 2024 | $2,106 | $31,500 | $3,570 | $27,930 |
| 2023 | $736 | $9,490 | $1,580 | $7,910 |
| 2022 | $732 | $9,485 | $1,575 | $7,910 |
| 2021 | $725 | $9,490 | $1,580 | $7,910 |
| 2020 | $687 | $7,770 | $1,300 | $6,480 |
| 2019 | $2,672 | $22,200 | $3,700 | $18,500 |
| 2018 | $598 | $7,770 | $1,300 | $6,480 |
| 2017 | $566 | $6,690 | $700 | $5,990 |
| 2016 | $561 | $6,690 | $700 | $5,990 |
| 2015 | $963 | $6,690 | $700 | $5,990 |
| 2014 | $963 | $7,420 | $770 | $6,650 |
Source: Public Records
Map
Nearby Homes
- 657 E 131st St
- 709 E 131st St
- 1427 E 133rd St
- 626 E 130th St
- 1524 E 133rd St
- 692 E 128th St
- 13405 Claiborne Rd
- 739 E 127th St
- 778 E 130th St
- 627 E 126th St
- 13500 Claiborne Rd
- 13401 Graham Rd
- 660 E 126th St
- 656 E 126th St
- 13413 Graham Rd
- 13508 Mann Ave
- 13412 Graham Rd
- 635 E 125th St
- 1276 E 133rd St
- 13314 Garden Rd