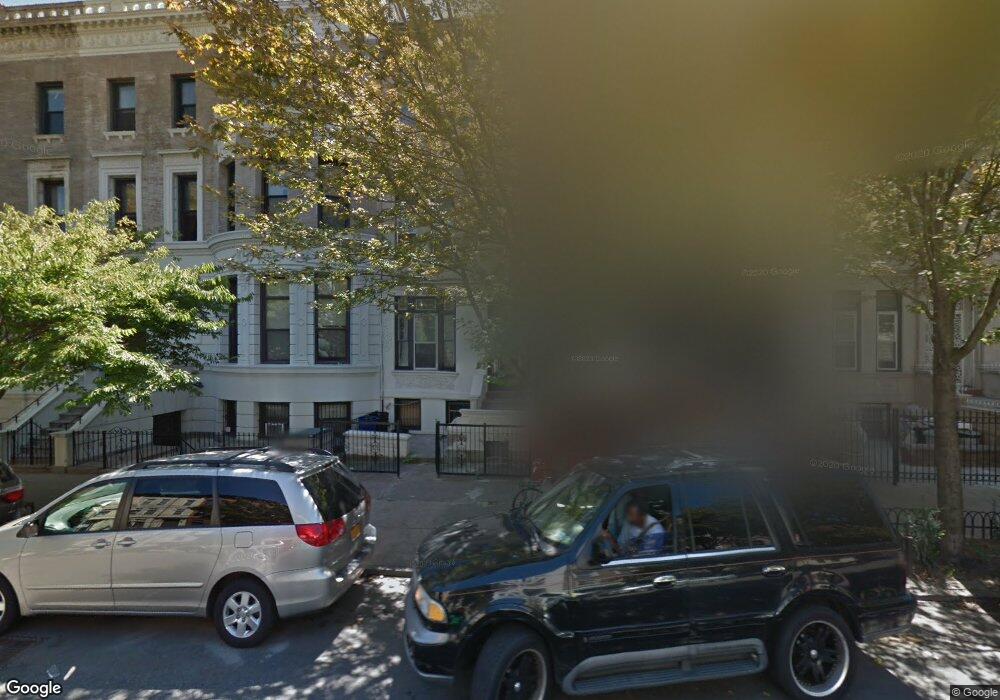
666 St Marks Ave Brooklyn, NY 11216
Crown Heights NeighborhoodEstimated Value: $1,432,000 - $2,204,714
--
Bed
3
Baths
3,536
Sq Ft
$534/Sq Ft
Est. Value
About This Home
This home is located at 666 St Marks Ave, Brooklyn, NY 11216 and is currently estimated at $1,888,679, approximately $534 per square foot. 666 St Marks Ave is a home located in Kings County with nearby schools including P.S. 138, Explore Exceed Charter Lower School, and Success Academy Prospect Heights.
Ownership History
Date
Name
Owned For
Owner Type
Purchase Details
Closed on
Nov 22, 2023
Sold by
Earl R Davis Real Estate Ssg Llc
Bought by
Steinman Isaac
Current Estimated Value
Purchase Details
Closed on
Apr 27, 2022
Sold by
666 St Marks Series and Earl R Davis Real Estate Ssg Llc
Bought by
666 St Marks Series and Earl R Davis Real Estate Ssg Llc
Purchase Details
Closed on
Apr 18, 2022
Sold by
Davis Family Real Estate Holdings Inc
Bought by
666 St Marks Series and Earl R Davis Real Estate Ssg Llc
Purchase Details
Closed on
Apr 15, 2022
Sold by
Ien Oswald and Newby Karen
Bought by
Davis Family Real Estate Holdings Inc
Purchase Details
Closed on
Mar 24, 2022
Sold by
Moyer Olisa
Bought by
Davis Family Real Estate Holdings Inc
Purchase Details
Closed on
Jun 12, 1998
Sold by
Haynes Frances and Haynes Joseph
Bought by
Warner Alma
Create a Home Valuation Report for This Property
The Home Valuation Report is an in-depth analysis detailing your home's value as well as a comparison with similar homes in the area
Home Values in the Area
Average Home Value in this Area
Purchase History
| Date | Buyer | Sale Price | Title Company |
|---|---|---|---|
| Steinman Isaac | $50,000 | -- | |
| 666 St Marks Series | $24,500 | -- | |
| 666 St Marks Series | -- | -- | |
| Davis Family Real Estate Holdings Inc | $20,000 | -- | |
| Davis Family Real Estate Holdings Inc | $10,000 | -- | |
| Warner Alma | -- | Chicago Title Insurance Co |
Source: Public Records
Tax History Compared to Growth
Tax History
| Year | Tax Paid | Tax Assessment Tax Assessment Total Assessment is a certain percentage of the fair market value that is determined by local assessors to be the total taxable value of land and additions on the property. | Land | Improvement |
|---|---|---|---|---|
| 2025 | $4,598 | $137,460 | $24,000 | $113,460 |
| 2024 | $4,598 | $110,280 | $24,000 | $86,280 |
| 2023 | $4,649 | $132,180 | $24,000 | $108,180 |
| 2022 | $4,492 | $135,540 | $24,000 | $111,540 |
| 2021 | $4,468 | $110,580 | $24,000 | $86,580 |
| 2020 | $1,951 | $118,860 | $24,000 | $94,860 |
| 2019 | $3,991 | $127,860 | $24,000 | $103,860 |
| 2018 | $3,889 | $19,076 | $3,625 | $15,451 |
| 2017 | $3,823 | $18,753 | $5,623 | $13,130 |
| 2016 | $3,537 | $17,694 | $6,280 | $11,414 |
| 2015 | $2,134 | $16,726 | $8,894 | $7,832 |
| 2014 | $2,134 | $15,897 | $10,141 | $5,756 |
Source: Public Records
Map
Nearby Homes
- 660 St Marks Ave
- 715 Prospect Place Unit 1B
- 698 Saint Marks Ave
- 732 Prospect Place
- 701 Prospect Place Unit 404
- 701 Prospect Place Unit 303
- 701 Prospect Place Unit 202
- 701 Prospect Place Unit 301
- 701 Prospect Place Unit 502
- 1431 Bedford Ave Unit 1A
- 84 Rogers Ave
- 86 Rogers Ave
- 1106 Bergen St
- 744 Park Place Unit 3B
- 744 Park Place Unit 2A
- 744 Park Place Unit 2B
- 744 Park Place Unit 3A
- 744 Park Place Unit 4B
- 744 Park Place Unit 1B
- 843 Prospect Place
- 666 Saint Marks Ave
- 666 St Marks Ave Unit TOWNHOUSE
- 666 St Marks Ave Unit HOUSE
- 666 Saint Marks Ave Unit HOUSE
- 664 Saint Marks Ave
- 662 Saint Marks Ave
- 662 St Marks Ave
- 660 St Marks Ave Unit 2
- 660 St Marks Ave Unit 1
- 670 Saint Marks Ave Unit 8
- 670 Saint Marks Ave Unit 2
- 670 Saint Marks Ave
- 670 Saint Marks Ave Unit 9
- 670 St Marks Ave Unit 10
- 660 Saint Marks Ave
- 672 St Marks Ave
- 672 St Marks Ave Unit G
- 672 St Marks Ave Unit 2
- 672 St Marks Ave Unit 1
- 672 St Marks Ave