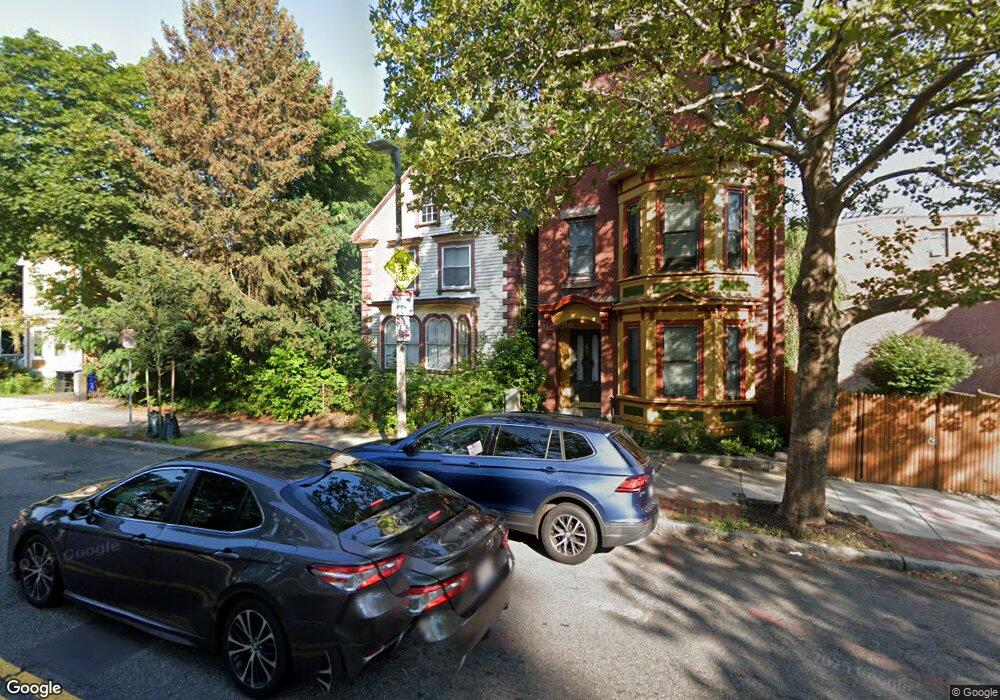
67 Centre St Roxbury, MA 02119
Fort Hill NeighborhoodEstimated Value: $624,282 - $1,224,000
4
Beds
4
Baths
2,780
Sq Ft
$357/Sq Ft
Est. Value
About This Home
This home is located at 67 Centre St, Roxbury, MA 02119 and is currently estimated at $992,071, approximately $356 per square foot. 67 Centre St is a home located in Suffolk County with nearby schools including Paige Academy, Malik Academy, and Manville School.
Ownership History
Date
Name
Owned For
Owner Type
Purchase Details
Closed on
May 1, 1995
Sold by
Das Pranab K and Das Phyllis J
Bought by
Moran James F
Current Estimated Value
Home Financials for this Owner
Home Financials are based on the most recent Mortgage that was taken out on this home.
Original Mortgage
$124,000
Interest Rate
8.33%
Mortgage Type
Purchase Money Mortgage
Purchase Details
Closed on
Jun 23, 1987
Sold by
Sullivan James E
Bought by
Johnson Mark T
Create a Home Valuation Report for This Property
The Home Valuation Report is an in-depth analysis detailing your home's value as well as a comparison with similar homes in the area
Home Values in the Area
Average Home Value in this Area
Purchase History
| Date | Buyer | Sale Price | Title Company |
|---|---|---|---|
| Moran James F | $155,000 | -- | |
| Johnson Mark T | $20,000 | -- |
Source: Public Records
Mortgage History
| Date | Status | Borrower | Loan Amount |
|---|---|---|---|
| Open | Johnson Mark T | $130,000 | |
| Closed | Johnson Mark T | $105,000 | |
| Closed | Johnson Mark T | $151,500 | |
| Closed | Johnson Mark T | $124,000 |
Source: Public Records
Tax History Compared to Growth
Tax History
| Year | Tax Paid | Tax Assessment Tax Assessment Total Assessment is a certain percentage of the fair market value that is determined by local assessors to be the total taxable value of land and additions on the property. | Land | Improvement |
|---|---|---|---|---|
| 2025 | $9,960 | $860,100 | $247,500 | $612,600 |
| 2024 | $9,231 | $846,900 | $208,800 | $638,100 |
| 2023 | $8,662 | $806,500 | $198,800 | $607,700 |
| 2022 | $8,519 | $783,000 | $193,000 | $590,000 |
| 2021 | $8,111 | $760,200 | $187,400 | $572,800 |
| 2020 | $7,259 | $687,400 | $156,800 | $530,600 |
| 2019 | $6,468 | $613,700 | $112,700 | $501,000 |
| 2018 | $5,955 | $568,200 | $112,700 | $455,500 |
| 2017 | $6,017 | $568,200 | $112,700 | $455,500 |
| 2016 | $5,437 | $494,300 | $112,700 | $381,600 |
| 2015 | $4,869 | $402,100 | $79,400 | $322,700 |
| 2014 | $4,598 | $365,500 | $79,400 | $286,100 |
Source: Public Records
Map
Nearby Homes
- 10 Linwood St
- 249 Roxbury St Unit 1
- 59 Fort Ave
- 743 Parker St Unit 3
- 31 Dorr St
- 49 Norfolk St
- 4 Fort Ave Unit 2
- 51 Beech Glen St Unit 3
- 22 Fisher Ave
- 63 Beech Glen St
- 27 Dudley St
- 38 Juniper St
- 9 W Cedar St Unit 1
- 9-45 Vale St
- 91-93 Calumet St
- 97 Hillside St
- 7 Oswald St
- 51 Saint James St
- 64 Alpine St Unit 104
- 64 Alpine St Unit 304
- 2 Centre Place
- 2 Centre Place Unit 1-4
- 69 Centre St
- 4 Centre Place
- 4 Centre Place Unit 3
- 4 Centre Place Unit 2
- 4 Centre Place Unit 1
- 4 Centre Place Unit 4
- 61 Centre St Unit 2
- 61 Centre St
- 6 Centre Place Unit 1
- 59 Centre St
- 71 Centre St Unit 73
- 1 Centre Place
- 3 Centre Place
- 5 Centre Place
- 5 Centre Place Unit 3
- 51-53 Linwood St
- 51 Linwood St Unit 53
- 75 Centre St