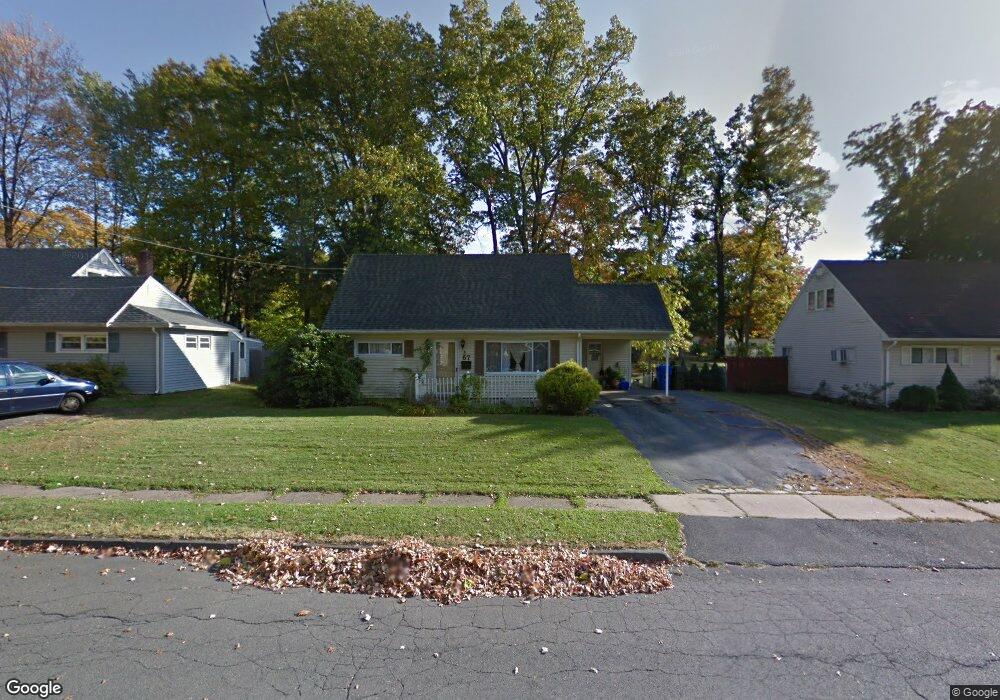
67 Legion Dr East Hartford, CT 06118
Estimated Value: $282,000 - $300,000
4
Beds
2
Baths
1,295
Sq Ft
$227/Sq Ft
Est. Value
About This Home
This home is located at 67 Legion Dr, East Hartford, CT 06118 and is currently estimated at $294,579, approximately $227 per square foot. 67 Legion Dr is a home located in Hartford County with nearby schools including Ocotillo Elementary School, Dr. Thomas S. O'Connell School, and East Hartford Middle School.
Ownership History
Date
Name
Owned For
Owner Type
Purchase Details
Closed on
Aug 23, 2010
Sold by
Rata Marichu
Bought by
Cantillo Silvestre
Current Estimated Value
Purchase Details
Closed on
Mar 17, 2006
Sold by
Ngo Dut and Truong Nhan Mythi
Bought by
Cantillo Silvestre and Cantillo Marites
Home Financials for this Owner
Home Financials are based on the most recent Mortgage that was taken out on this home.
Original Mortgage
$146,400
Interest Rate
7.6%
Purchase Details
Closed on
Oct 22, 2001
Sold by
Corey Robert J
Bought by
Ngo Du T and Truong Nhan Mythi
Purchase Details
Closed on
Oct 30, 2000
Sold by
Monteiro Lisa C and Goncalves Fernando
Bought by
Corey Robert J
Purchase Details
Closed on
Oct 7, 1991
Sold by
Flanagan Michael and Flanagan Laura B
Bought by
Serrano Hipolito
Create a Home Valuation Report for This Property
The Home Valuation Report is an in-depth analysis detailing your home's value as well as a comparison with similar homes in the area
Home Values in the Area
Average Home Value in this Area
Purchase History
| Date | Buyer | Sale Price | Title Company |
|---|---|---|---|
| Cantillo Silvestre | -- | -- | |
| Cantillo Silvestre | $183,000 | -- | |
| Ngo Du T | $115,000 | -- | |
| Corey Robert J | $160,000 | -- | |
| Serrano Hipolito | $125,000 | -- |
Source: Public Records
Mortgage History
| Date | Status | Borrower | Loan Amount |
|---|---|---|---|
| Previous Owner | Serrano Hipolito | $146,400 | |
| Previous Owner | Serrano Hipolito | $36,600 | |
| Previous Owner | Serrano Hipolito | $62,500 |
Source: Public Records
Tax History Compared to Growth
Tax History
| Year | Tax Paid | Tax Assessment Tax Assessment Total Assessment is a certain percentage of the fair market value that is determined by local assessors to be the total taxable value of land and additions on the property. | Land | Improvement |
|---|---|---|---|---|
| 2025 | $5,687 | $123,910 | $42,530 | $81,380 |
| 2024 | $5,452 | $123,910 | $42,530 | $81,380 |
| 2023 | $5,271 | $123,910 | $42,530 | $81,380 |
| 2022 | $5,080 | $123,910 | $42,530 | $81,380 |
| 2021 | $4,408 | $89,320 | $32,220 | $57,100 |
| 2020 | $4,459 | $89,320 | $32,220 | $57,100 |
| 2019 | $4,387 | $89,320 | $32,220 | $57,100 |
| 2018 | $4,257 | $89,320 | $32,220 | $57,100 |
| 2017 | $4,203 | $89,320 | $32,220 | $57,100 |
| 2016 | $4,193 | $91,420 | $32,220 | $59,200 |
| 2015 | $4,193 | $91,420 | $32,220 | $59,200 |
| 2014 | $4,150 | $91,420 | $32,220 | $59,200 |
Source: Public Records
Map
Nearby Homes