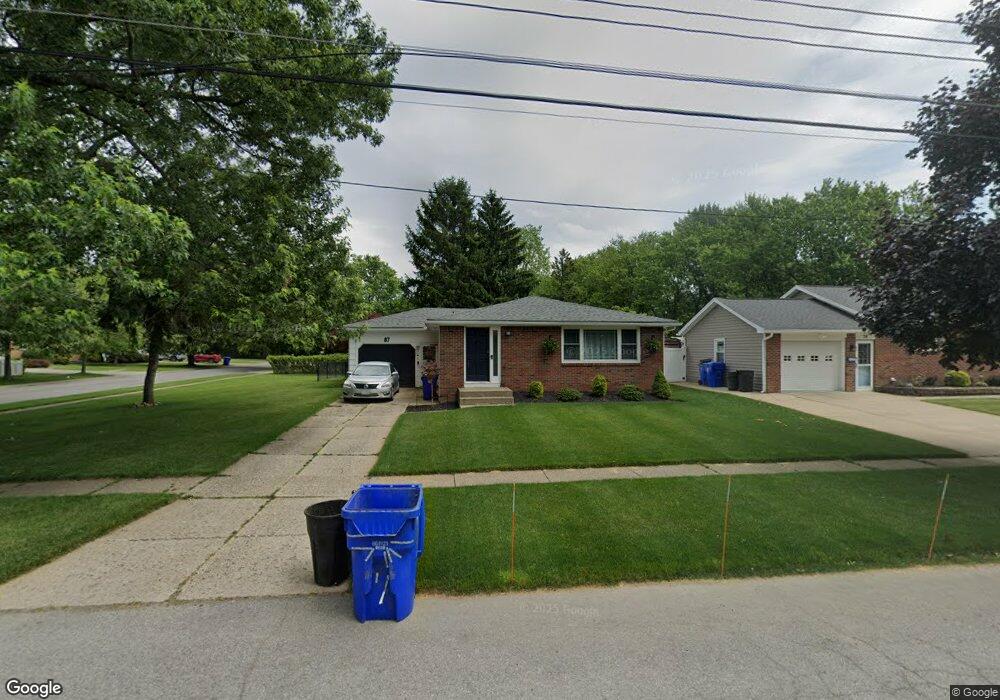
67 Sunnyside Dr Buffalo, NY 14224
Estimated Value: $245,000 - $285,000
3
Beds
1
Bath
1,176
Sq Ft
$223/Sq Ft
Est. Value
About This Home
This home is located at 67 Sunnyside Dr, Buffalo, NY 14224 and is currently estimated at $262,444, approximately $223 per square foot. 67 Sunnyside Dr is a home located in Erie County with nearby schools including East Middle School, West Seneca East Senior High School, and Trinity Lutheran School.
Ownership History
Date
Name
Owned For
Owner Type
Purchase Details
Closed on
Feb 4, 2022
Sold by
Rusch Caroline
Bought by
Zielinski Amy
Current Estimated Value
Purchase Details
Closed on
Apr 21, 2016
Sold by
Schoenborn Susan A and Rusch Susan A
Bought by
Rusch Caroline
Home Financials for this Owner
Home Financials are based on the most recent Mortgage that was taken out on this home.
Original Mortgage
$134,148
Interest Rate
3.75%
Mortgage Type
FHA
Purchase Details
Closed on
Aug 24, 2007
Sold by
Kissel Michael W
Bought by
Rusch Susan A
Home Financials for this Owner
Home Financials are based on the most recent Mortgage that was taken out on this home.
Original Mortgage
$82,600
Interest Rate
6.71%
Mortgage Type
Unknown
Purchase Details
Closed on
Feb 3, 1997
Sold by
Flury and Flury James J
Bought by
Kissel Michael W
Create a Home Valuation Report for This Property
The Home Valuation Report is an in-depth analysis detailing your home's value as well as a comparison with similar homes in the area
Home Values in the Area
Average Home Value in this Area
Purchase History
| Date | Buyer | Sale Price | Title Company |
|---|---|---|---|
| Zielinski Amy | $182,000 | None Available | |
| Rusch Caroline | $137,000 | None Available | |
| Rusch Susan A | $118,000 | None Available | |
| Kissel Michael W | $78,000 | -- |
Source: Public Records
Mortgage History
| Date | Status | Borrower | Loan Amount |
|---|---|---|---|
| Previous Owner | Rusch Caroline | $134,148 | |
| Previous Owner | Rusch Susan A | $82,600 |
Source: Public Records
Tax History Compared to Growth
Tax History
| Year | Tax Paid | Tax Assessment Tax Assessment Total Assessment is a certain percentage of the fair market value that is determined by local assessors to be the total taxable value of land and additions on the property. | Land | Improvement |
|---|---|---|---|---|
| 2024 | $5,595 | $53,200 | $9,300 | $43,900 |
| 2023 | $5,335 | $53,200 | $9,300 | $43,900 |
| 2022 | $5,145 | $53,200 | $9,300 | $43,900 |
| 2021 | $5,108 | $53,200 | $9,300 | $43,900 |
| 2020 | $5,097 | $53,200 | $9,300 | $43,900 |
| 2019 | $4,948 | $53,200 | $9,300 | $43,900 |
| 2018 | $4,927 | $53,200 | $9,300 | $43,900 |
| 2017 | $2,350 | $53,200 | $9,300 | $43,900 |
| 2016 | $4,169 | $53,200 | $9,300 | $43,900 |
| 2015 | -- | $53,200 | $9,300 | $43,900 |
| 2014 | -- | $53,200 | $9,300 | $43,900 |
Source: Public Records
Map
Nearby Homes
- 59 Sunnyside Dr
- 283 Norwood Dr
- 77 Sunnyside Dr
- 53 Sunnyside Dr
- 282 Norwood Dr
- 66 Sunnyside Dr
- 58 Sunnyside Dr
- 291 Norwood Dr
- 16 Carol Dr
- 85 Sunnyside Dr
- 76 Sunnyside Dr
- 52 Sunnyside Dr
- 290 Norwood Dr
- 237 Norwood Dr
- 84 Sunnyside Dr
- 91 Sunnyside Dr
- 44 Sunnyside Dr
- 208 Norwood Dr
- 235 Norwood Dr
- 90 Sunnyside Dr