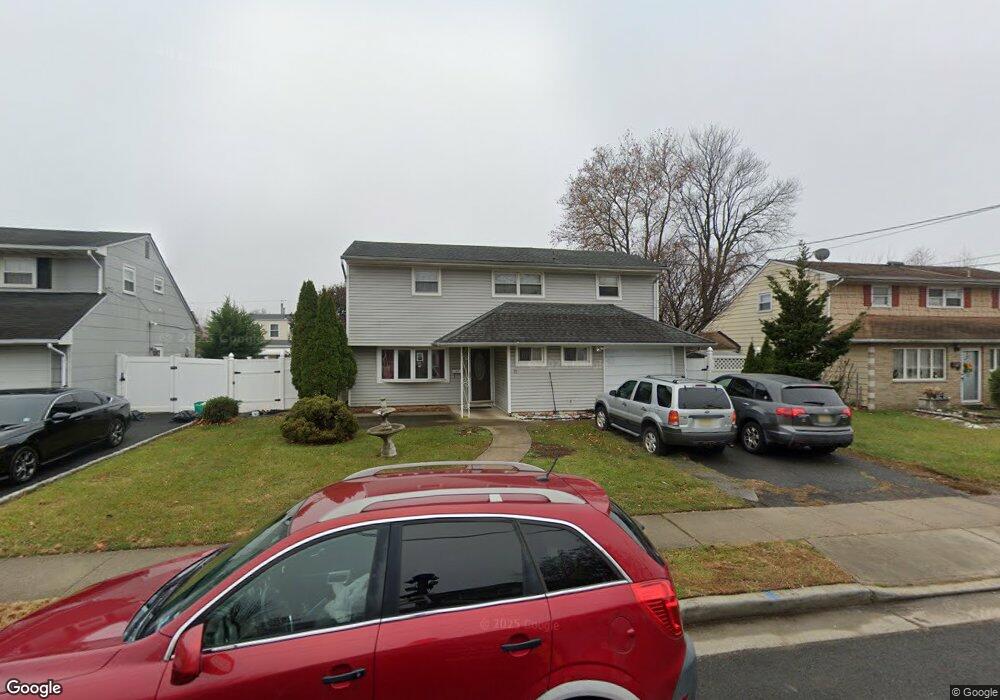
67 Tennyson St Carteret, NJ 07008
Estimated Value: $548,781 - $650,000
3
Beds
2
Baths
1,586
Sq Ft
$372/Sq Ft
Est. Value
About This Home
This home is located at 67 Tennyson St, Carteret, NJ 07008 and is currently estimated at $589,445, approximately $371 per square foot. 67 Tennyson St is a home located in Middlesex County with nearby schools including Carteret High School and St Joseph School.
Ownership History
Date
Name
Owned For
Owner Type
Purchase Details
Closed on
Oct 13, 2017
Sold by
67 Tennyeson Llc
Bought by
Akudinobi Ora Brenda
Current Estimated Value
Home Financials for this Owner
Home Financials are based on the most recent Mortgage that was taken out on this home.
Original Mortgage
$271,982
Outstanding Balance
$227,242
Interest Rate
3.83%
Mortgage Type
FHA
Estimated Equity
$362,203
Purchase Details
Closed on
Oct 20, 2015
Sold by
Chen Lue and Pan Meiling
Bought by
67 Tennyson Llc
Purchase Details
Closed on
Dec 11, 2006
Sold by
Oliver Real
Bought by
Chen Lue and Pan Mei Ling
Home Financials for this Owner
Home Financials are based on the most recent Mortgage that was taken out on this home.
Original Mortgage
$252,400
Interest Rate
6.16%
Purchase Details
Closed on
Oct 4, 2002
Sold by
Garra Sharon
Bought by
Oliver Real
Home Financials for this Owner
Home Financials are based on the most recent Mortgage that was taken out on this home.
Original Mortgage
$202,500
Interest Rate
6.34%
Create a Home Valuation Report for This Property
The Home Valuation Report is an in-depth analysis detailing your home's value as well as a comparison with similar homes in the area
Home Values in the Area
Average Home Value in this Area
Purchase History
| Date | Buyer | Sale Price | Title Company |
|---|---|---|---|
| Akudinobi Ora Brenda | $277,000 | Vital Abstract Llc | |
| 67 Tennyson Llc | -- | Chicago Title Insurance Comp | |
| Chen Lue | $315,500 | -- | |
| Oliver Real | $225,000 | -- |
Source: Public Records
Mortgage History
| Date | Status | Borrower | Loan Amount |
|---|---|---|---|
| Open | Akudinobi Ora Brenda | $271,982 | |
| Previous Owner | Chen Lue | $252,400 | |
| Previous Owner | Oliver Real | $202,500 |
Source: Public Records
Tax History Compared to Growth
Tax History
| Year | Tax Paid | Tax Assessment Tax Assessment Total Assessment is a certain percentage of the fair market value that is determined by local assessors to be the total taxable value of land and additions on the property. | Land | Improvement |
|---|---|---|---|---|
| 2025 | $7,597 | $525,000 | $339,900 | $185,100 |
| 2024 | $7,402 | $238,300 | $123,800 | $114,500 |
| 2023 | $7,402 | $238,300 | $123,800 | $114,500 |
| 2022 | $7,197 | $238,300 | $123,800 | $114,500 |
| 2021 | $5,274 | $238,300 | $123,800 | $114,500 |
| 2020 | $6,854 | $238,300 | $123,800 | $114,500 |
| 2019 | $6,656 | $238,300 | $123,800 | $114,500 |
| 2018 | $6,498 | $238,300 | $123,800 | $114,500 |
| 2017 | $6,267 | $238,300 | $123,800 | $114,500 |
| 2016 | $6,546 | $206,700 | $93,800 | $112,900 |
| 2015 | $6,451 | $206,700 | $93,800 | $112,900 |
| 2014 | $6,170 | $206,700 | $93,800 | $112,900 |
Source: Public Records
Map
Nearby Homes
- 85 Whitman St
- 34 Taylor Ave
- 140 Whitman St
- 89 Tennyson St
- 43 Charlotte St
- 4 Monroe Ave
- 26 Fillmore Ave
- 29 Swarthmore Dr
- 7 Sunnyside Dr
- 17 Wedgewood Dr
- 3 State St
- 10 Van Buren Ave
- 779 Roosevelt Ave
- 6 Elmwood Ave
- 98 Wortylko St
- 117 Hagaman St
- 114 Daniel St
- 245 Carteret Ave
- 118 Markowitz St
- 123 Heald St