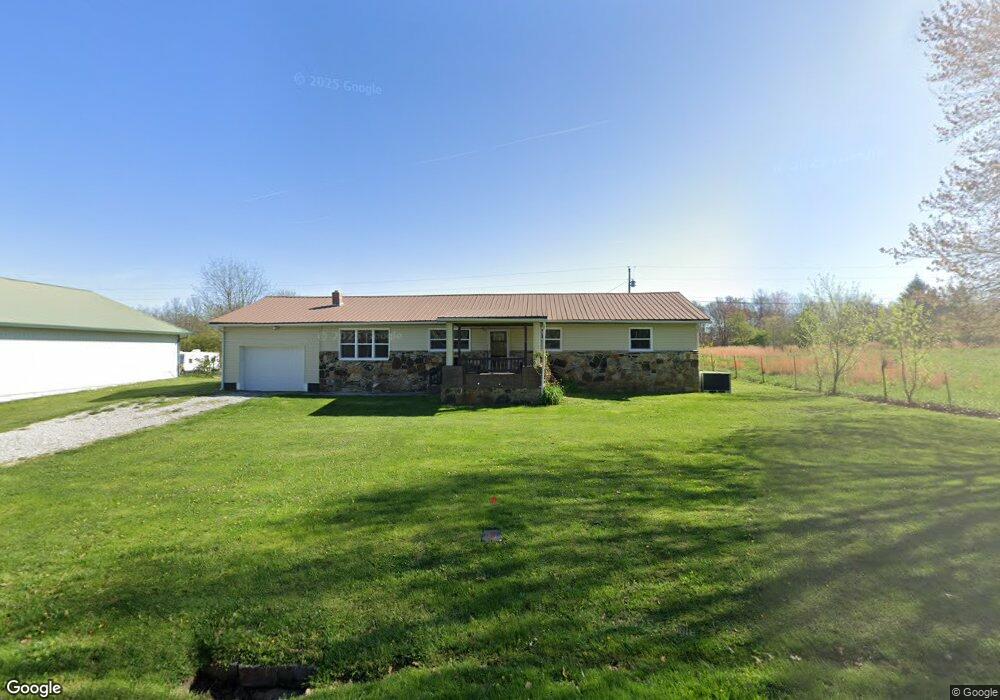
670 Gordon Rd Crossville, TN 38572
Estimated Value: $234,000 - $290,000
--
Bed
2
Baths
1,766
Sq Ft
$142/Sq Ft
Est. Value
About This Home
This home is located at 670 Gordon Rd, Crossville, TN 38572 and is currently estimated at $250,476, approximately $141 per square foot. 670 Gordon Rd is a home located in Cumberland County with nearby schools including Cumberland County High School.
Ownership History
Date
Name
Owned For
Owner Type
Purchase Details
Closed on
Aug 4, 2023
Sold by
Sullivan Sadie Rosetta
Bought by
Edington Christopher E and Edington Rebecca L
Current Estimated Value
Home Financials for this Owner
Home Financials are based on the most recent Mortgage that was taken out on this home.
Original Mortgage
$42,500
Outstanding Balance
$26,490
Interest Rate
6.67%
Mortgage Type
New Conventional
Estimated Equity
$223,986
Purchase Details
Closed on
Apr 1, 1987
Bought by
Sullivan Lonnie L and Sullivan Sadie
Create a Home Valuation Report for This Property
The Home Valuation Report is an in-depth analysis detailing your home's value as well as a comparison with similar homes in the area
Home Values in the Area
Average Home Value in this Area
Purchase History
| Date | Buyer | Sale Price | Title Company |
|---|---|---|---|
| Edington Christopher E | $50,000 | None Listed On Document | |
| Sullivan Lonnie L | $6,000 | -- |
Source: Public Records
Mortgage History
| Date | Status | Borrower | Loan Amount |
|---|---|---|---|
| Open | Edington Christopher E | $42,500 |
Source: Public Records
Tax History Compared to Growth
Tax History
| Year | Tax Paid | Tax Assessment Tax Assessment Total Assessment is a certain percentage of the fair market value that is determined by local assessors to be the total taxable value of land and additions on the property. | Land | Improvement |
|---|---|---|---|---|
| 2024 | $425 | $37,425 | $1,875 | $35,550 |
| 2023 | $425 | $37,425 | $0 | $0 |
| 2022 | $425 | $37,425 | $1,875 | $35,550 |
| 2021 | $291 | $18,575 | $1,875 | $16,700 |
| 2020 | $291 | $18,575 | $1,875 | $16,700 |
| 2019 | $291 | $18,575 | $1,875 | $16,700 |
| 2018 | $291 | $18,575 | $1,875 | $16,700 |
| 2017 | $291 | $18,575 | $1,875 | $16,700 |
| 2016 | $283 | $18,500 | $1,875 | $16,625 |
| 2015 | $277 | $18,500 | $1,875 | $16,625 |
| 2014 | $277 | $18,500 | $0 | $0 |
Source: Public Records
Map
Nearby Homes