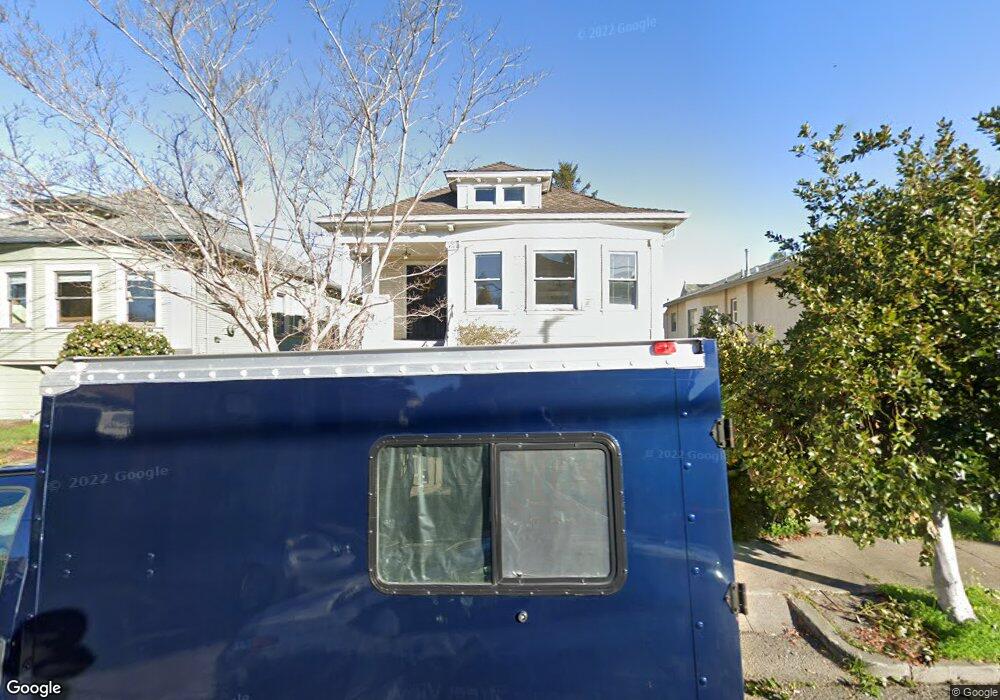
670 Poirier St Oakland, CA 94609
Bushrod NeighborhoodEstimated Value: $846,000 - $1,166,764
2
Beds
2
Baths
1,247
Sq Ft
$821/Sq Ft
Est. Value
About This Home
This home is located at 670 Poirier St, Oakland, CA 94609 and is currently estimated at $1,023,441, approximately $820 per square foot. 670 Poirier St is a home located in Alameda County with nearby schools including Sankofa United Elementary School, Peralta Elementary School, and Claremont Middle School.
Ownership History
Date
Name
Owned For
Owner Type
Purchase Details
Closed on
Jul 2, 1999
Sold by
Weber Ralf and Larner Sharon
Bought by
Emmanouilides Martha Vasilia
Current Estimated Value
Home Financials for this Owner
Home Financials are based on the most recent Mortgage that was taken out on this home.
Original Mortgage
$236,000
Outstanding Balance
$64,436
Interest Rate
7.24%
Estimated Equity
$959,005
Create a Home Valuation Report for This Property
The Home Valuation Report is an in-depth analysis detailing your home's value as well as a comparison with similar homes in the area
Home Values in the Area
Average Home Value in this Area
Purchase History
| Date | Buyer | Sale Price | Title Company |
|---|---|---|---|
| Emmanouilides Martha Vasilia | $300,000 | Fidelity National Title Co |
Source: Public Records
Mortgage History
| Date | Status | Borrower | Loan Amount |
|---|---|---|---|
| Open | Emmanouilides Martha Vasilia | $236,000 |
Source: Public Records
Tax History Compared to Growth
Tax History
| Year | Tax Paid | Tax Assessment Tax Assessment Total Assessment is a certain percentage of the fair market value that is determined by local assessors to be the total taxable value of land and additions on the property. | Land | Improvement |
|---|---|---|---|---|
| 2025 | $7,466 | $454,066 | $138,320 | $322,746 |
| 2024 | $7,466 | $445,027 | $135,608 | $316,419 |
| 2023 | $7,792 | $443,165 | $132,949 | $310,216 |
| 2022 | $7,563 | $427,477 | $130,343 | $304,134 |
| 2021 | $7,182 | $418,960 | $127,788 | $298,172 |
| 2020 | $7,102 | $421,595 | $126,478 | $295,117 |
| 2019 | $6,804 | $413,330 | $123,999 | $289,331 |
| 2018 | $6,663 | $405,227 | $121,568 | $283,659 |
| 2017 | $6,397 | $397,283 | $119,185 | $278,098 |
| 2016 | $6,156 | $389,495 | $116,848 | $272,647 |
| 2015 | $6,122 | $383,645 | $115,093 | $268,552 |
| 2014 | $6,161 | $376,130 | $112,839 | $263,291 |
Source: Public Records
Map
Nearby Homes