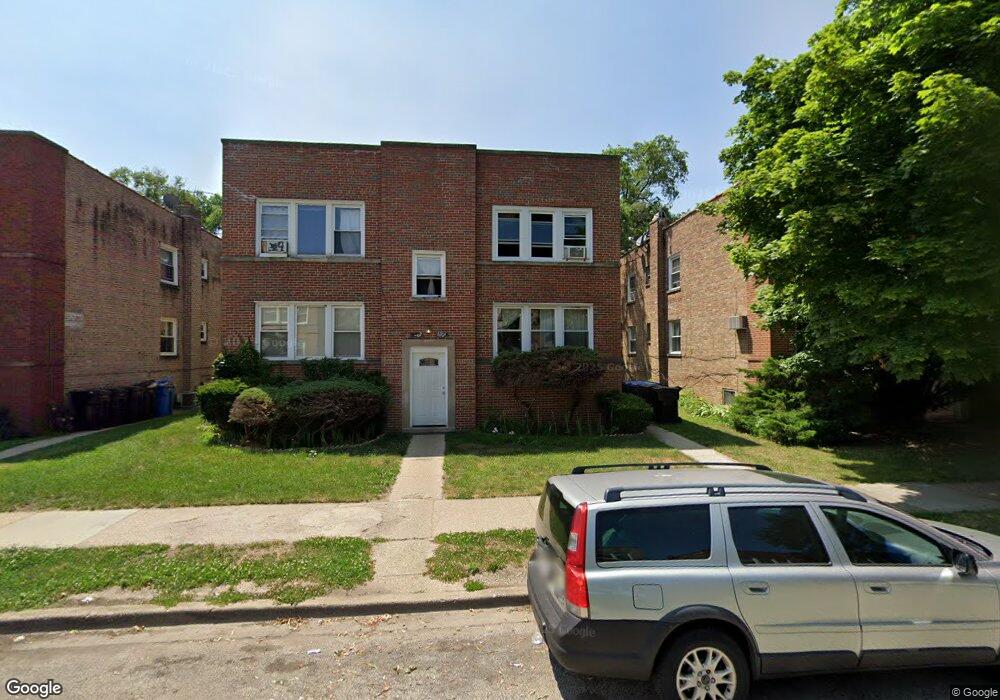
6704 N Seeley Ave Unit 1N Chicago, IL 60645
West Ridge NeighborhoodEstimated Value: $124,000 - $138,000
--
Bed
--
Bath
6,930
Sq Ft
$19/Sq Ft
Est. Value
About This Home
This home is located at 6704 N Seeley Ave Unit 1N, Chicago, IL 60645 and is currently estimated at $133,692, approximately $19 per square foot. 6704 N Seeley Ave Unit 1N is a home located in Cook County with nearby schools including George Armstrong Elementary School, Sullivan High School, and God's Battle Axe Prayer Academy.
Ownership History
Date
Name
Owned For
Owner Type
Purchase Details
Closed on
Jul 12, 2016
Sold by
Sacks Jeffrey
Bought by
Kashim Mohammad A
Current Estimated Value
Purchase Details
Closed on
Oct 4, 2006
Sold by
Squire Mitchell B
Bought by
Sacks Jeffrey
Purchase Details
Closed on
Jun 4, 1998
Sold by
Khan Mohammed and Maqsood Waheeda
Bought by
Squire Mitchell B
Home Financials for this Owner
Home Financials are based on the most recent Mortgage that was taken out on this home.
Original Mortgage
$63,750
Interest Rate
7.27%
Purchase Details
Closed on
Jan 18, 1996
Sold by
Polakoff Lois J and Polakoff Edythe
Bought by
Polakoff George and Polakoff Edythe
Purchase Details
Closed on
Sep 30, 1994
Sold by
Patel Nita B
Bought by
Khan Mohammed and Maqsood Waheeda
Home Financials for this Owner
Home Financials are based on the most recent Mortgage that was taken out on this home.
Original Mortgage
$60,800
Interest Rate
8.75%
Create a Home Valuation Report for This Property
The Home Valuation Report is an in-depth analysis detailing your home's value as well as a comparison with similar homes in the area
Home Values in the Area
Average Home Value in this Area
Purchase History
| Date | Buyer | Sale Price | Title Company |
|---|---|---|---|
| Kashim Mohammad A | $80,000 | First American Title | |
| Sacks Jeffrey | -- | Chicago Title Insurance Co | |
| Squire Mitchell B | $75,000 | -- | |
| Polakoff George | -- | -- | |
| Khan Mohammed | $64,000 | Attorneys Natl Title Network |
Source: Public Records
Mortgage History
| Date | Status | Borrower | Loan Amount |
|---|---|---|---|
| Previous Owner | Squire Mitchell B | $63,750 | |
| Previous Owner | Khan Mohammed | $60,800 |
Source: Public Records
Tax History Compared to Growth
Tax History
| Year | Tax Paid | Tax Assessment Tax Assessment Total Assessment is a certain percentage of the fair market value that is determined by local assessors to be the total taxable value of land and additions on the property. | Land | Improvement |
|---|---|---|---|---|
| 2024 | $323 | $11,000 | $3,534 | $7,466 |
| 2023 | $135 | $7,500 | $2,827 | $4,673 |
| 2022 | $135 | $7,500 | $2,827 | $4,673 |
| 2021 | $1,508 | $7,499 | $2,827 | $4,672 |
| 2020 | $2,866 | $12,864 | $2,670 | $10,194 |
| 2019 | $2,867 | $14,270 | $2,670 | $11,600 |
| 2018 | $2,819 | $14,270 | $2,670 | $11,600 |
| 2017 | $937 | $10,430 | $2,356 | $8,074 |
| 2016 | $2,089 | $10,430 | $2,356 | $8,074 |
| 2015 | $1,911 | $10,430 | $2,356 | $8,074 |
| 2014 | $1,551 | $8,359 | $2,120 | $6,239 |
| 2013 | $1,600 | $8,799 | $2,120 | $6,679 |
Source: Public Records
Map
Nearby Homes
- 1937 W Pratt Blvd Unit 2N
- 2065 W Farwell Ave Unit 20653N
- 6561 N Seeley Ave
- 6801 N Wolcott Ave
- 2130 W Farwell Ave
- 2036 W Morse Ave Unit D
- 2217 W Farwell Ave Unit 2B
- 1958 W Morse Ave Unit B
- 6959 N Ridge Blvd Unit 1C
- 2245 W Farwell Ave Unit 3B
- 2241 W Farwell Ave Unit 2D
- 2243 W Farwell Ave Unit 3D
- 2025 W Arthur Ave Unit C2
- 2111 W Arthur Ave Unit 1S
- 6827 N Oakley Ave Unit 3C
- 6500 N Ridge Blvd Unit 4E
- 2300 W Farwell Ave Unit 2
- 7019 N Ridge Blvd Unit 3B
- 7019 N Ridge Blvd Unit 3A
- 6433 N Damen Ave Unit 3E
- 6704 N Seeley Ave Unit 2N
- 6702 N Seeley Ave Unit 1S
- 6702 N Seeley Ave Unit 2S
- 6706 N Seeley Ave Unit 1S
- 6708 N Seeley Ave Unit 2N
- 6706 N Seeley Ave Unit 2S
- 6708 N Seeley Ave Unit 1N
- 6662 N Seeley Ave Unit 1N
- 6662 N Seeley Ave Unit 2N
- 6660 N Seeley Ave Unit 2S
- 6660 N Seeley Ave Unit 1S
- 6714 N Seeley Ave Unit 1S
- 6716 N Seeley Ave Unit 2N
- 6714 N Seeley Ave Unit 2S
- 6716 N Seeley Ave Unit 1N
- 6658 N Seeley Ave Unit 6658B
- 6658 N Seeley Ave Unit 6658A
- 6658 N Seeley Ave Unit 2N
- 6656 N Seeley Ave Unit 6656A
- 6656 N Seeley Ave Unit 6656B