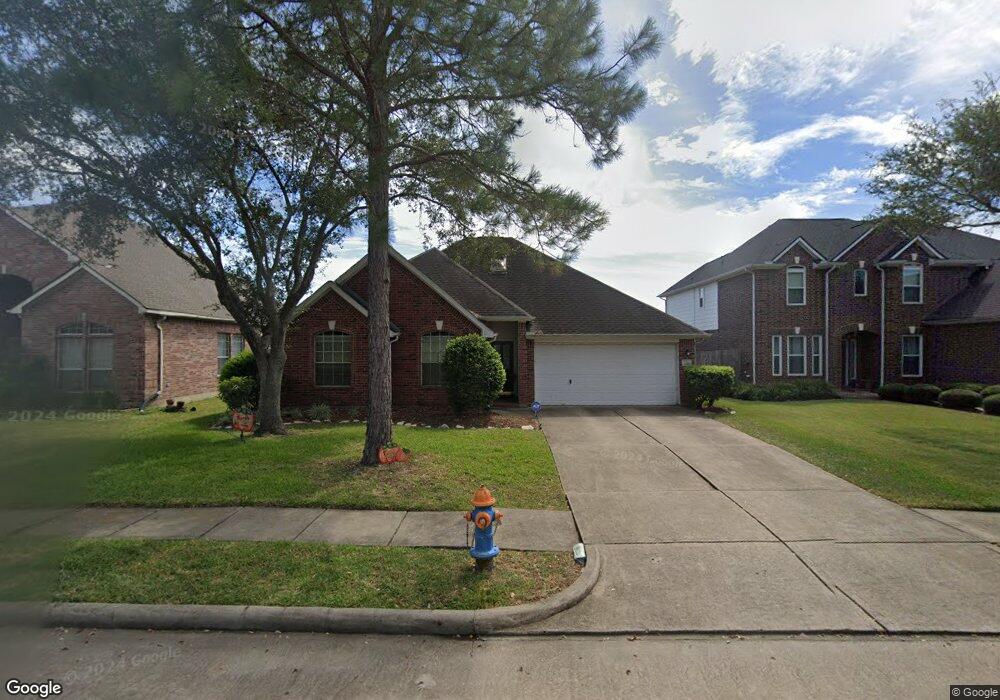
6716 Keithwood Cir S Pearland, TX 77584
Estimated Value: $313,175 - $326,000
3
Beds
2
Baths
2,018
Sq Ft
$158/Sq Ft
Est. Value
About This Home
This home is located at 6716 Keithwood Cir S, Pearland, TX 77584 and is currently estimated at $318,544, approximately $157 per square foot. 6716 Keithwood Cir S is a home located in Brazoria County with nearby schools including H.C. Carleston Elementary School, Sam Jamison Middle School, and Pearland Junior High School South.
Ownership History
Date
Name
Owned For
Owner Type
Purchase Details
Closed on
Sep 2, 2016
Sold by
Wells Fargo Bank
Bought by
Smith Pink and Smith Alexis
Current Estimated Value
Home Financials for this Owner
Home Financials are based on the most recent Mortgage that was taken out on this home.
Original Mortgage
$162,000
Outstanding Balance
$129,524
Interest Rate
3.46%
Estimated Equity
$189,020
Purchase Details
Closed on
Mar 5, 2016
Sold by
Dickerson Anthony and Matthews Ingrid R
Bought by
Wells Fargo Bank
Purchase Details
Closed on
Jan 30, 2003
Sold by
Dickerson Anthony and Matthews Ingrid R
Bought by
Wells Fargo Bank Na
Purchase Details
Closed on
May 31, 2001
Sold by
Mhi Partnership Ltd
Bought by
Dickerson Anthony and Matthews Ingrid R
Home Financials for this Owner
Home Financials are based on the most recent Mortgage that was taken out on this home.
Original Mortgage
$119,950
Interest Rate
8.87%
Create a Home Valuation Report for This Property
The Home Valuation Report is an in-depth analysis detailing your home's value as well as a comparison with similar homes in the area
Home Values in the Area
Average Home Value in this Area
Purchase History
| Date | Buyer | Sale Price | Title Company |
|---|---|---|---|
| Smith Pink | -- | -- | |
| Wells Fargo Bank | -- | None Available | |
| Wells Fargo Bank Na | $149,000 | None Available | |
| Dickerson Anthony | -- | Millennium Title |
Source: Public Records
Mortgage History
| Date | Status | Borrower | Loan Amount |
|---|---|---|---|
| Open | Smith Pink | $162,000 | |
| Closed | Smith Pink | -- | |
| Previous Owner | Dickerson Anthony | $119,950 | |
| Closed | Dickerson Anthony | $29,950 |
Source: Public Records
Tax History Compared to Growth
Tax History
| Year | Tax Paid | Tax Assessment Tax Assessment Total Assessment is a certain percentage of the fair market value that is determined by local assessors to be the total taxable value of land and additions on the property. | Land | Improvement |
|---|---|---|---|---|
| 2025 | $4,956 | $305,810 | $27,720 | $278,090 |
| 2023 | $4,956 | $265,317 | $27,720 | $284,800 |
| 2022 | $6,345 | $241,197 | $27,720 | $228,540 |
| 2021 | $6,242 | $219,270 | $24,950 | $194,320 |
| 2020 | $6,552 | $219,270 | $24,950 | $194,320 |
| 2019 | $6,109 | $203,030 | $23,100 | $179,930 |
| 2018 | $5,874 | $196,010 | $23,100 | $172,910 |
| 2017 | $6,155 | $201,790 | $23,100 | $178,690 |
| 2016 | $6,155 | $201,790 | $23,100 | $178,690 |
| 2014 | $5,011 | $154,070 | $23,100 | $130,970 |
Source: Public Records
Map
Nearby Homes
- 3304 Autumn Forest Dr
- 6806 Adella Ct
- 7123 Elgin St
- 3402 Windmill Palm Dr
- 6407 Hillock Ln
- 3610 Kale St
- 7333 Fite Rd
- 9.6 AC Fite Rd
- 3510 Dorsey Ln
- 3114 Autumn Ct
- 3638 Manvel Rd
- 6504 Patridge Dr
- 6406 Patridge Dr
- 6108 Jordan Dr
- 6204 Raintree Dr
- 3902 Bluebird Way
- 3237 Harkey Rd
- 6112 Tomorrow Cir
- 3506 Windmill Palm Dr
- 3818 Wingtail Way
- 6714 Keithwood Cir S
- 6718 Keithwood Cir S
- 6712 Keithwood Cir S
- 6802 Keithwood Cir S
- 6712 Keithwood CI
- 6715 Keithwood Cir S
- 6713 Keithwood Cir S
- 6717 Keithwood Cir S
- 6710 Keithwood Cir S Unit S
- 6804 Keithwood Cir S
- 6711 Keithwood Cir S
- 6711 Keithwood Cir S
- 6801 Keithwood Cir S
- 6709 Keithwood Cir S
- 6709 Keithwood Cir S Unit 5
- 6806 Keithwood Cir S
- 6708 Keithwood Cir S
- 6806 Keithwood CI
- 6803 Keithwood Cir S
- 6716 Kevincrest Dr