Estimated Value: $359,000 - $377,000
3
Beds
2
Baths
2,438
Sq Ft
$151/Sq Ft
Est. Value
About This Home
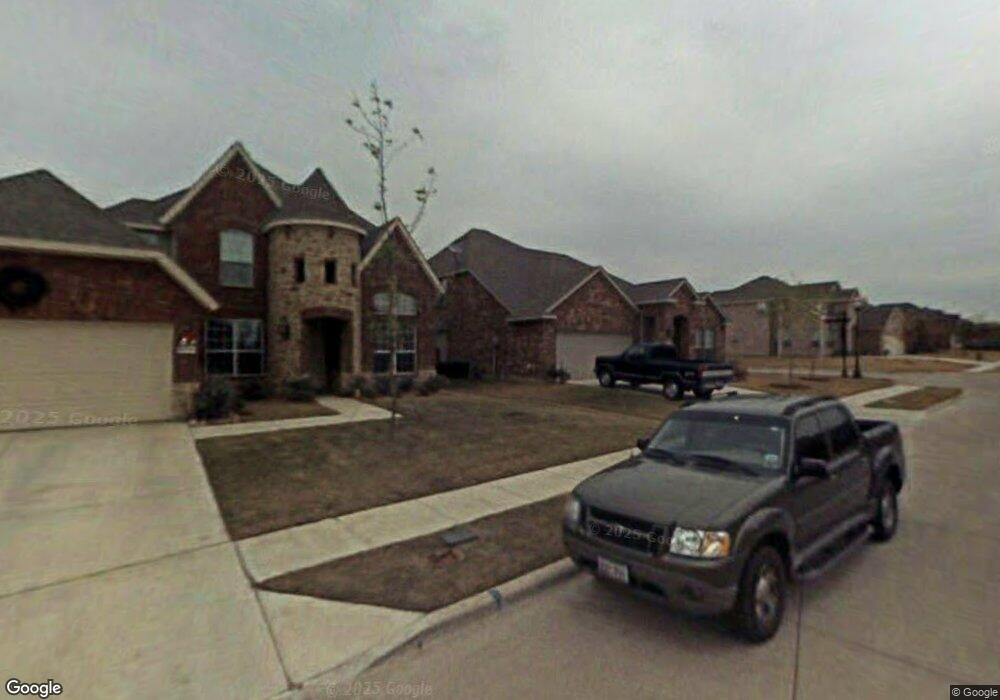
This home is located at 673 Crockett Dr, Lavon, TX 75166 and is currently estimated at $367,632, approximately $150 per square foot. 673 Crockett Dr is a home located in Collin County with nearby schools including Nesmith Elementary School, Community High School, and Wylie Preparatory Academy.
Ownership History
Date
Name
Owned For
Owner Type
Purchase Details
Closed on
Sep 10, 2008
Sold by
Mayhand Michael and Mayhand Michelle
Bought by
Daffin Eugene and Daffin Linda
Current Estimated Value
Home Financials for this Owner
Home Financials are based on the most recent Mortgage that was taken out on this home.
Original Mortgage
$150,265
Outstanding Balance
$100,043
Interest Rate
6.54%
Mortgage Type
Purchase Money Mortgage
Estimated Equity
$267,589
Purchase Details
Closed on
Jun 27, 2007
Sold by
Bowen Family Homes Of Texas Inc
Bought by
Mayhand Michael and Mayhand Michelle
Home Financials for this Owner
Home Financials are based on the most recent Mortgage that was taken out on this home.
Original Mortgage
$131,381
Interest Rate
6.37%
Mortgage Type
Purchase Money Mortgage
Create a Home Valuation Report for This Property
The Home Valuation Report is an in-depth analysis detailing your home's value as well as a comparison with similar homes in the area
Home Values in the Area
Average Home Value in this Area
Purchase History
| Date | Buyer | Sale Price | Title Company |
|---|---|---|---|
| Daffin Eugene | -- | Ctic | |
| Mayhand Michael | -- | Reunion |
Source: Public Records
Mortgage History
| Date | Status | Borrower | Loan Amount |
|---|---|---|---|
| Open | Daffin Eugene | $150,265 | |
| Previous Owner | Mayhand Michael | $131,381 |
Source: Public Records
Tax History Compared to Growth
Tax History
| Year | Tax Paid | Tax Assessment Tax Assessment Total Assessment is a certain percentage of the fair market value that is determined by local assessors to be the total taxable value of land and additions on the property. | Land | Improvement |
|---|---|---|---|---|
| 2025 | $3,981 | $364,650 | $102,000 | $262,650 |
| 2024 | $3,981 | $373,237 | $102,000 | $282,822 |
| 2023 | $3,981 | $339,306 | $102,000 | $289,476 |
| 2022 | $6,498 | $308,460 | $84,000 | $273,283 |
| 2021 | $6,137 | $280,418 | $66,000 | $214,418 |
| 2020 | $6,245 | $271,096 | $66,000 | $205,096 |
| 2019 | $6,451 | $270,186 | $66,000 | $204,186 |
| 2018 | $5,916 | $251,470 | $66,000 | $186,461 |
| 2017 | $5,379 | $242,540 | $66,000 | $176,540 |
| 2016 | $4,926 | $223,434 | $48,000 | $175,434 |
| 2015 | $3,793 | $203,949 | $42,000 | $161,949 |
Source: Public Records
Map
Nearby Homes
- 682 Crockett Dr
- 638 Bonham Dr
- Seaberry Plan at Bear Creek at Grand Heritage - Bear Creek Classic 60
- Willow Plan at Bear Creek at Grand Heritage - Bear Creek Elements
- Dogwood III Plan at Bear Creek at Grand Heritage - Bear Creek Classic 50
- Magnolia Plan at Bear Creek at Grand Heritage - Bear Creek Classic 60
- Woodrose Plan at Bear Creek at Grand Heritage - Bear Creek Elements
- Cypress II Plan at Bear Creek at Grand Heritage - Bear Creek Classic 60
- Kirlin Plan at Bear Creek at Grand Heritage
- Rose III Plan at Bear Creek at Grand Heritage - Bear Creek Classic 60
- Portico Plan at Bear Creek at Grand Heritage
- Rose Plan at Bear Creek at Grand Heritage - Bear Creek Classic 60
- Magnolia II Plan at Bear Creek at Grand Heritage - Bear Creek Classic 60
- Carolina II Plan at Bear Creek at Grand Heritage - Bear Creek Classic 50
- Hawthorne Plan at Bear Creek at Grand Heritage - Bear Creek Classic 60
- Magnolia III Plan at Bear Creek at Grand Heritage - Bear Creek Classic 50
- Carolina III Plan at Bear Creek at Grand Heritage - Bear Creek Classic 60
- Bellflower Plan at Bear Creek at Grand Heritage - Bear Creek Classic 60
- Carolina IV Plan at Bear Creek at Grand Heritage - Bear Creek Classic 50
- Spring Cress Plan at Bear Creek at Grand Heritage - Bear Creek Classic 60