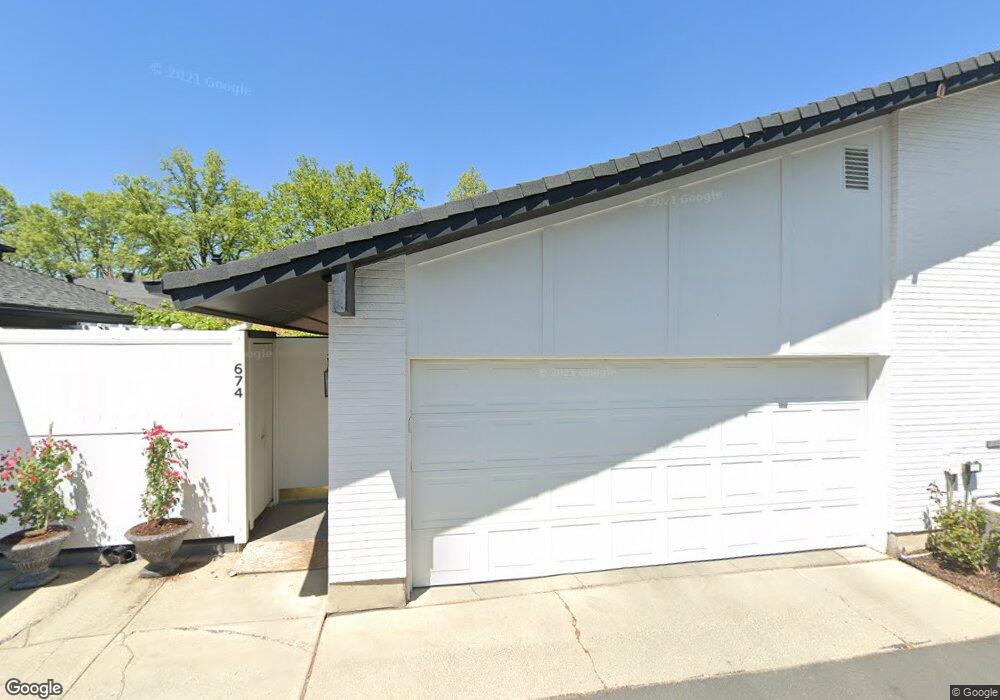
674 E 4119 S Salt Lake City, UT 84107
Estimated Value: $524,000 - $600,000
4
Beds
3
Baths
2,800
Sq Ft
$199/Sq Ft
Est. Value
About This Home
This home is located at 674 E 4119 S, Salt Lake City, UT 84107 and is currently estimated at $558,054, approximately $199 per square foot. 674 E 4119 S is a home located in Salt Lake County with nearby schools including James E Moss Elementary School, Bonneville Junior High School, and Cottonwood High School.
Ownership History
Date
Name
Owned For
Owner Type
Purchase Details
Closed on
Oct 15, 2021
Sold by
Empey Cannon Wanda Miller
Bought by
Wanda And Emerson Cannon Trust
Current Estimated Value
Home Financials for this Owner
Home Financials are based on the most recent Mortgage that was taken out on this home.
Original Mortgage
$380,000
Outstanding Balance
$346,525
Interest Rate
2.8%
Mortgage Type
New Conventional
Estimated Equity
$211,529
Purchase Details
Closed on
Oct 14, 2021
Sold by
Cannon Clinton C and Empey Carl F
Bought by
Boone Ronald
Home Financials for this Owner
Home Financials are based on the most recent Mortgage that was taken out on this home.
Original Mortgage
$380,000
Outstanding Balance
$346,525
Interest Rate
2.8%
Mortgage Type
New Conventional
Estimated Equity
$211,529
Purchase Details
Closed on
Jul 12, 1996
Sold by
Cannon Emerson and Cannon Wanda M
Bought by
Wanda And Emerson Cannon Trust
Create a Home Valuation Report for This Property
The Home Valuation Report is an in-depth analysis detailing your home's value as well as a comparison with similar homes in the area
Home Values in the Area
Average Home Value in this Area
Purchase History
| Date | Buyer | Sale Price | Title Company |
|---|---|---|---|
| Wanda And Emerson Cannon Trust | -- | -- | |
| Boone Ronald | -- | Sutherland Title | |
| Wanda And Emerson Cannon Trust | -- | -- | |
| Wanda And Emerson Cannon Trust | -- | -- |
Source: Public Records
Mortgage History
| Date | Status | Borrower | Loan Amount |
|---|---|---|---|
| Open | Boone Ronald | $380,000 |
Source: Public Records
Tax History Compared to Growth
Tax History
| Year | Tax Paid | Tax Assessment Tax Assessment Total Assessment is a certain percentage of the fair market value that is determined by local assessors to be the total taxable value of land and additions on the property. | Land | Improvement |
|---|---|---|---|---|
| 2025 | $3,256 | $518,000 | $155,400 | $362,600 |
| 2024 | $3,256 | $507,000 | $152,100 | $354,900 |
| 2023 | $3,387 | $508,800 | $152,600 | $356,200 |
| 2022 | $3,108 | $470,100 | $141,000 | $329,100 |
| 2021 | $2,570 | $337,000 | $101,100 | $235,900 |
| 2020 | $2,415 | $348,800 | $104,600 | $244,200 |
| 2019 | $2,409 | $340,000 | $102,000 | $238,000 |
| 2018 | $2,964 | $392,700 | $117,800 | $274,900 |
| 2017 | $2,570 | $359,800 | $107,900 | $251,900 |
| 2016 | $2,287 | $328,100 | $98,400 | $229,700 |
| 2015 | $2,308 | $312,200 | $93,600 | $218,600 |
| 2014 | $217 | $309,100 | $92,700 | $216,400 |
Source: Public Records
Map
Nearby Homes
- 689 E 4149 S
- 657 E 4065 S Unit C
- 4178 S 650 E
- 4040 S 685 E Unit F
- 4040 S 685 E Unit F
- 651 E 4025 S Unit G
- 665 E 4025 S Unit H
- 607 E 4030 S
- 4247 S 615 E
- 779 E 4070 S
- 635 E 4025 S Unit C
- 4264 S Steele Creek Ct
- 584 E 3990 S
- 830 E Grand Cayman Dr
- 842 E 4170 S
- 4289 S 730 E
- 832 E 4170 S
- 838 E 4170 S
- 834 E 4170 S
- 495 E Mary Rose Dr
- 674 E 4119 S Unit 3
- 680 E 4119 S
- 668 E 4119 S
- 686 E 4119 S
- 662 E 4119 S Unit 1
- 692 E 4119 S
- 675 E 4129 S
- 681 E 4129 S
- 669 E 4129 S
- 663 E 4129 S
- 693 E 4129 S
- 656 E 4116 S
- 4105 S 670 E Unit H
- 4105 S 670 E Unit E
- 4105 S 670 E Unit G
- 4105 S 670 E Unit F
- 4105 S 670 E Unit 255 G
- 654 E 4116 S Unit 76
- 4110 S 670 E Unit E
- 4110 S 670 E Unit H