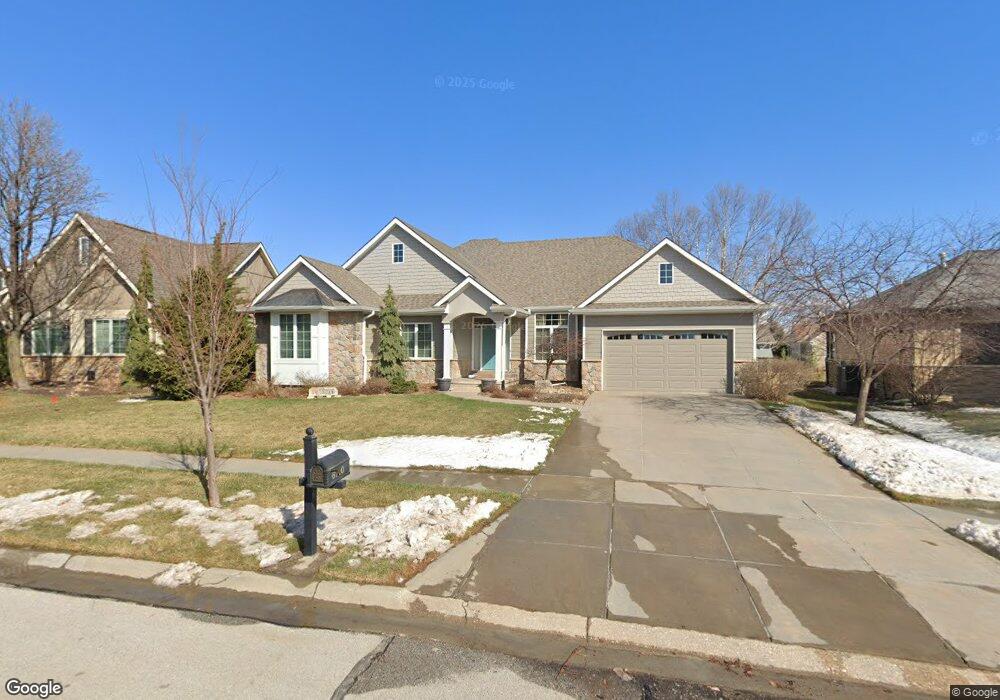
6740 NW 4th St Lincoln, NE 68521
Fallbrook NeighborhoodEstimated Value: $579,695 - $666,000
4
Beds
3
Baths
3,441
Sq Ft
$180/Sq Ft
Est. Value
About This Home
This home is located at 6740 NW 4th St, Lincoln, NE 68521 and is currently estimated at $617,924, approximately $179 per square foot. 6740 NW 4th St is a home located in Lancaster County with nearby schools including Kooser Elementary School, Schoo Middle School, and North Star High School.
Ownership History
Date
Name
Owned For
Owner Type
Purchase Details
Closed on
Aug 22, 2017
Sold by
Petersen David C and Petersen Karen Lelia
Bought by
Burger Ryan L and Burger Lisa M
Current Estimated Value
Home Financials for this Owner
Home Financials are based on the most recent Mortgage that was taken out on this home.
Original Mortgage
$300,000
Outstanding Balance
$160,446
Interest Rate
3.96%
Mortgage Type
New Conventional
Estimated Equity
$457,478
Purchase Details
Closed on
Nov 14, 2005
Sold by
Anthem Custom Homes Llc
Bought by
Petersen David C and Petersen Karen Lelia
Home Financials for this Owner
Home Financials are based on the most recent Mortgage that was taken out on this home.
Original Mortgage
$254,000
Interest Rate
6.06%
Mortgage Type
Fannie Mae Freddie Mac
Purchase Details
Closed on
Sep 22, 2004
Sold by
Rembolt Development Inc
Bought by
Anthem Custom Homes Llc
Purchase Details
Closed on
Jul 12, 2004
Sold by
Abel Investment Co
Bought by
Rembolt Development Ltd
Create a Home Valuation Report for This Property
The Home Valuation Report is an in-depth analysis detailing your home's value as well as a comparison with similar homes in the area
Home Values in the Area
Average Home Value in this Area
Purchase History
| Date | Buyer | Sale Price | Title Company |
|---|---|---|---|
| Burger Ryan L | $395,000 | Neb | |
| Petersen David C | $318,000 | Ct | |
| Anthem Custom Homes Llc | $20,000 | -- | |
| Rembolt Development Ltd | $40,000 | -- |
Source: Public Records
Mortgage History
| Date | Status | Borrower | Loan Amount |
|---|---|---|---|
| Open | Burger Ryan L | $300,000 | |
| Previous Owner | Petersen David C | $254,000 |
Source: Public Records
Tax History Compared to Growth
Tax History
| Year | Tax Paid | Tax Assessment Tax Assessment Total Assessment is a certain percentage of the fair market value that is determined by local assessors to be the total taxable value of land and additions on the property. | Land | Improvement |
|---|---|---|---|---|
| 2025 | $7,036 | $587,200 | $90,000 | $497,200 |
| 2024 | $7,036 | $509,100 | $90,000 | $419,100 |
| 2023 | $8,533 | $509,100 | $90,000 | $419,100 |
| 2022 | $7,994 | $401,100 | $65,000 | $336,100 |
| 2021 | $7,563 | $401,100 | $65,000 | $336,100 |
| 2020 | $7,082 | $371,900 | $65,000 | $306,900 |
| 2019 | $7,006 | $371,900 | $65,000 | $306,900 |
| 2018 | $7,012 | $370,600 | $65,000 | $305,600 |
| 2017 | $7,073 | $370,600 | $65,000 | $305,600 |
| 2016 | $6,412 | $325,300 | $45,000 | $280,300 |
| 2015 | $6,439 | $325,300 | $45,000 | $280,300 |
| 2014 | $6,618 | $333,900 | $45,000 | $288,900 |
| 2013 | -- | $333,900 | $45,000 | $288,900 |
Source: Public Records
Map
Nearby Homes
- 6901 NW 3rd St
- 6931 NW 2nd St
- 6921 NW 4th St
- 301 Lilac Dr
- 6941 NW 2nd St
- 351 Lilac Dr
- 350 Bushclover Rd
- 6951 NW 2nd St
- 336 Bushclover Rd
- 330 Lilac Dr
- 7011 NW 2nd St
- 7015 NW 3rd St
- 7025 NW 3rd St
- 6500 Windflower Rd
- 7100 NW 3rd St
- 6442 Windflower Rd
- 567 Blue Sage Blvd
- 583 Blue Sage Blvd
- 7121 NW 2nd St
- 591 Blue Sage Blvd
- 6730 NW 4th St
- 6800 NW 4th St
- 6735 NW 3rd St
- 6725 NW 3rd St
- 6810 NW 4th St
- 6811 NW 3rd St
- 6715 NW 3rd St
- 6710 W Wildrye Rd
- 6801 NW 4th St
- 6730 W Wildrye Rd
- 6821 NW 3rd St
- 6701 NW 3rd St
- 6820 NW 4th St
- 6815 NW 4th St
- 6835 NW 3rd St
- 6740 W Wildrye Rd
- 6730 NW 3rd St
- 6830 NW 4th St
- 6800 NW 3rd St
- 6825 NW 4th St