Estimated Value: $917,000 - $992,000
4
Beds
3
Baths
2,476
Sq Ft
$383/Sq Ft
Est. Value
About This Home
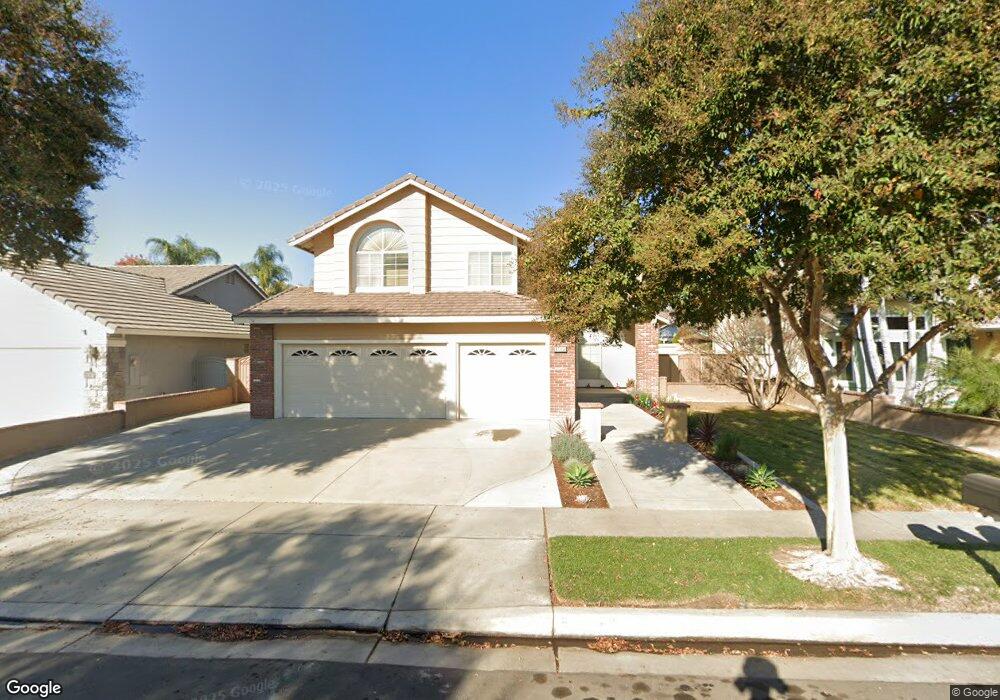
This home is located at 6742 Elm Ct, Chino, CA 91710 and is currently estimated at $947,414, approximately $382 per square foot. 6742 Elm Ct is a home located in San Bernardino County with nearby schools including Edwin Rhodes Elementary, Magnolia Junior High, and Chino High School.
Ownership History
Date
Name
Owned For
Owner Type
Purchase Details
Closed on
Apr 1, 2020
Sold by
Vazquez Victor M
Bought by
Vazquez Victor Manuel and The V A N A 4 Trust U A Dated
Current Estimated Value
Purchase Details
Closed on
Jun 10, 2004
Sold by
Vazquez Victor M and Grande Magloria
Bought by
Vazquez Victor M
Home Financials for this Owner
Home Financials are based on the most recent Mortgage that was taken out on this home.
Original Mortgage
$310,000
Outstanding Balance
$152,454
Interest Rate
6.09%
Mortgage Type
Credit Line Revolving
Estimated Equity
$794,960
Purchase Details
Closed on
Jan 23, 2001
Sold by
Lopez Samuel R and Lopez Pamela S
Bought by
Vazquez Victor M and Grande Magloria
Home Financials for this Owner
Home Financials are based on the most recent Mortgage that was taken out on this home.
Original Mortgage
$233,100
Interest Rate
6.89%
Create a Home Valuation Report for This Property
The Home Valuation Report is an in-depth analysis detailing your home's value as well as a comparison with similar homes in the area
Home Values in the Area
Average Home Value in this Area
Purchase History
| Date | Buyer | Sale Price | Title Company |
|---|---|---|---|
| Vazquez Victor Manuel | -- | None Available | |
| Vazquez Victor M | -- | National Title Service | |
| Vazquez Victor M | $259,000 | Orange Coast Title |
Source: Public Records
Mortgage History
| Date | Status | Borrower | Loan Amount |
|---|---|---|---|
| Open | Vazquez Victor M | $310,000 | |
| Closed | Vazquez Victor M | $233,100 |
Source: Public Records
Tax History Compared to Growth
Tax History
| Year | Tax Paid | Tax Assessment Tax Assessment Total Assessment is a certain percentage of the fair market value that is determined by local assessors to be the total taxable value of land and additions on the property. | Land | Improvement |
|---|---|---|---|---|
| 2025 | $5,243 | $466,610 | $154,078 | $312,532 |
| 2024 | $5,243 | $457,461 | $151,057 | $306,404 |
| 2023 | $5,103 | $448,491 | $148,095 | $300,396 |
| 2022 | $5,074 | $439,697 | $145,191 | $294,506 |
| 2021 | $4,978 | $431,075 | $142,344 | $288,731 |
| 2020 | $4,916 | $426,654 | $140,884 | $285,770 |
| 2019 | $4,833 | $418,289 | $138,122 | $280,167 |
| 2018 | $4,731 | $410,088 | $135,414 | $274,674 |
| 2017 | $4,650 | $402,047 | $132,759 | $269,288 |
| 2016 | $4,356 | $394,164 | $130,156 | $264,008 |
| 2015 | $4,273 | $388,243 | $128,201 | $260,042 |
| 2014 | $4,191 | $380,638 | $125,690 | $254,948 |
Source: Public Records
Map
Nearby Homes
- 6594 Manzanita Ct
- 6952 Silverado St
- 13846 Farmhouse Ave
- 6570 Encina St
- 13775 Harvard Ave
- 14170 Durazno Ave
- 13462 Mashona Ave
- 13360 Goldmedal Ave
- 14380 Belhaven Ave
- 14134 Mountain Ave
- 6956 Dublin Dr
- 14349 Guilford Ave
- 6212 Athena St
- 6685 Eucalyptus Ave
- 6501 Wheaton St
- 6550 Eucalyptus Ave
- 6641 Eucalyptus Ave
- 11610 Granville Place
- 6169 Winona St
- 6599 Eucalyptus Ave
- 6752 Elm Ct
- 6732 Elm Ct
- 6741 Manzanita St
- 6762 Elm Ct
- 6731 Manzanita St
- 6751 Manzanita St
- 6761 Manzanita St
- 6743 Elm Ct
- 6753 Elm Ct
- 6733 Elm Ct
- 6772 Elm Ct
- 13882 Live Oak Ct
- 13890 Live Oak Ct
- 6771 Manzanita St
- 13874 Live Oak Ct
- 6763 Elm Ct
- 13902 Live Oak Ct
- 13866 Live Oak Ct
- 13910 Live Oak Ct
- 13927 Live Oak Ct