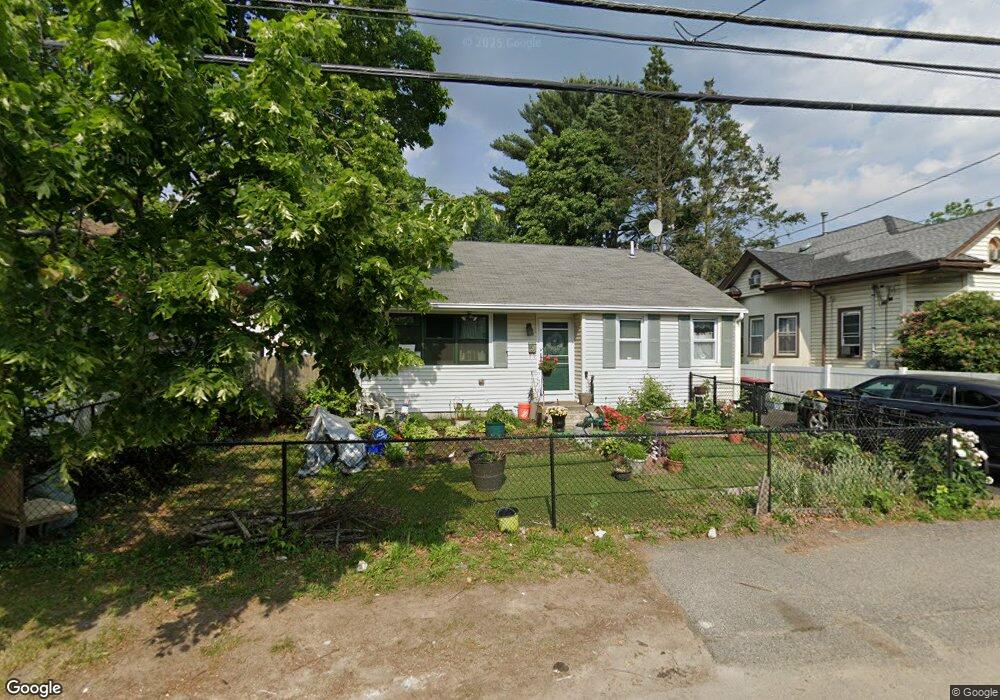
68 Carl Ave Brockton, MA 02302
Campello NeighborhoodEstimated Value: $459,000 - $522,000
3
Beds
1
Bath
1,439
Sq Ft
$349/Sq Ft
Est. Value
About This Home
This home is located at 68 Carl Ave, Brockton, MA 02302 and is currently estimated at $502,162, approximately $348 per square foot. 68 Carl Ave is a home located in Plymouth County with nearby schools including Davis K-8 School, John F. Kennedy Elementary School, and South Middle School.
Ownership History
Date
Name
Owned For
Owner Type
Purchase Details
Closed on
Aug 16, 2005
Sold by
Bryant Keith A and Bryant Carole J
Bought by
Thompson James and Thompson Jasmin
Current Estimated Value
Home Financials for this Owner
Home Financials are based on the most recent Mortgage that was taken out on this home.
Original Mortgage
$226,400
Outstanding Balance
$118,012
Interest Rate
5.54%
Mortgage Type
Purchase Money Mortgage
Estimated Equity
$384,150
Purchase Details
Closed on
Feb 3, 1992
Sold by
Gammon David R
Bought by
Bryant Keith A and Bryant Carole J
Home Financials for this Owner
Home Financials are based on the most recent Mortgage that was taken out on this home.
Original Mortgage
$99,336
Interest Rate
8.44%
Mortgage Type
Purchase Money Mortgage
Create a Home Valuation Report for This Property
The Home Valuation Report is an in-depth analysis detailing your home's value as well as a comparison with similar homes in the area
Home Values in the Area
Average Home Value in this Area
Purchase History
| Date | Buyer | Sale Price | Title Company |
|---|---|---|---|
| Thompson James | $283,000 | -- | |
| Bryant Keith A | $99,300 | -- |
Source: Public Records
Mortgage History
| Date | Status | Borrower | Loan Amount |
|---|---|---|---|
| Open | Bryant Keith A | $226,400 | |
| Closed | Bryant Keith A | $56,600 | |
| Previous Owner | Bryant Keith A | $25,000 | |
| Previous Owner | Bryant Keith A | $99,336 |
Source: Public Records
Tax History Compared to Growth
Tax History
| Year | Tax Paid | Tax Assessment Tax Assessment Total Assessment is a certain percentage of the fair market value that is determined by local assessors to be the total taxable value of land and additions on the property. | Land | Improvement |
|---|---|---|---|---|
| 2025 | $5,120 | $422,800 | $156,400 | $266,400 |
| 2024 | $4,790 | $398,500 | $156,400 | $242,100 |
| 2023 | $4,858 | $374,300 | $106,500 | $267,800 |
| 2022 | $4,666 | $334,000 | $96,800 | $237,200 |
| 2021 | $48,527 | $283,200 | $88,700 | $194,500 |
| 2020 | $46,903 | $265,500 | $78,300 | $187,200 |
| 2019 | $45,317 | $257,100 | $74,300 | $182,800 |
| 2018 | $3,620 | $225,400 | $74,300 | $151,100 |
| 2017 | $3,460 | $214,900 | $74,300 | $140,600 |
| 2016 | $3,236 | $186,400 | $70,900 | $115,500 |
| 2015 | $2,891 | $159,300 | $70,900 | $88,400 |
| 2014 | $2,944 | $162,400 | $70,900 | $91,500 |
Source: Public Records
Map
Nearby Homes