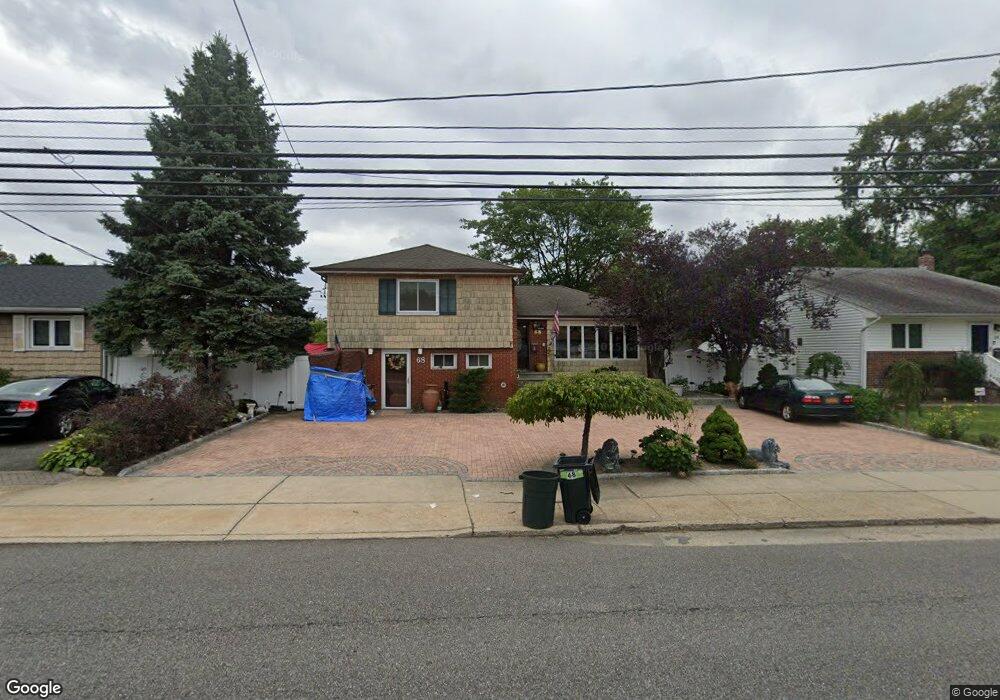
68 Linden St Massapequa Park, NY 11762
Estimated Value: $828,000 - $879,913
--
Bed
3
Baths
1,972
Sq Ft
$433/Sq Ft
Est. Value
About This Home
This home is located at 68 Linden St, Massapequa Park, NY 11762 and is currently estimated at $853,957, approximately $433 per square foot. 68 Linden St is a home located in Nassau County with nearby schools including Albany Avenue Elementary School, Weldon E. Howitt Middle School, and Farmingdale Senior High School.
Ownership History
Date
Name
Owned For
Owner Type
Purchase Details
Closed on
Nov 24, 2009
Sold by
Arab Gillian
Bought by
Lofaso Fred J and Lofaso Emily L
Current Estimated Value
Home Financials for this Owner
Home Financials are based on the most recent Mortgage that was taken out on this home.
Original Mortgage
$280,000
Outstanding Balance
$183,754
Interest Rate
5.02%
Mortgage Type
Purchase Money Mortgage
Estimated Equity
$670,203
Purchase Details
Closed on
Apr 13, 2004
Sold by
Arab Gillian
Purchase Details
Closed on
Nov 21, 2000
Sold by
Ohalleran Michael
Bought by
Arab Ghazi and Arab Gillian
Create a Home Valuation Report for This Property
The Home Valuation Report is an in-depth analysis detailing your home's value as well as a comparison with similar homes in the area
Home Values in the Area
Average Home Value in this Area
Purchase History
| Date | Buyer | Sale Price | Title Company |
|---|---|---|---|
| Lofaso Fred J | $430,000 | -- | |
| -- | -- | -- | |
| Arab Ghazi | $280,000 | Scott Malin |
Source: Public Records
Mortgage History
| Date | Status | Borrower | Loan Amount |
|---|---|---|---|
| Open | Lofaso Fred J | $280,000 |
Source: Public Records
Tax History Compared to Growth
Tax History
| Year | Tax Paid | Tax Assessment Tax Assessment Total Assessment is a certain percentage of the fair market value that is determined by local assessors to be the total taxable value of land and additions on the property. | Land | Improvement |
|---|---|---|---|---|
| 2025 | $12,019 | $473 | $180 | $293 |
| 2024 | $3,166 | $468 | $178 | $290 |
| 2023 | $11,114 | $489 | $186 | $303 |
| 2022 | $11,114 | $489 | $186 | $303 |
| 2021 | $10,603 | $471 | $179 | $292 |
| 2020 | $9,860 | $588 | $498 | $90 |
| 2019 | $9,324 | $630 | $501 | $129 |
| 2018 | $9,402 | $672 | $0 | $0 |
| 2017 | $6,804 | $714 | $504 | $210 |
| 2016 | $9,532 | $756 | $461 | $295 |
| 2015 | $2,694 | $798 | $487 | $311 |
| 2014 | $2,694 | $798 | $487 | $311 |
| 2013 | $2,764 | $875 | $534 | $341 |
Source: Public Records
Map
Nearby Homes