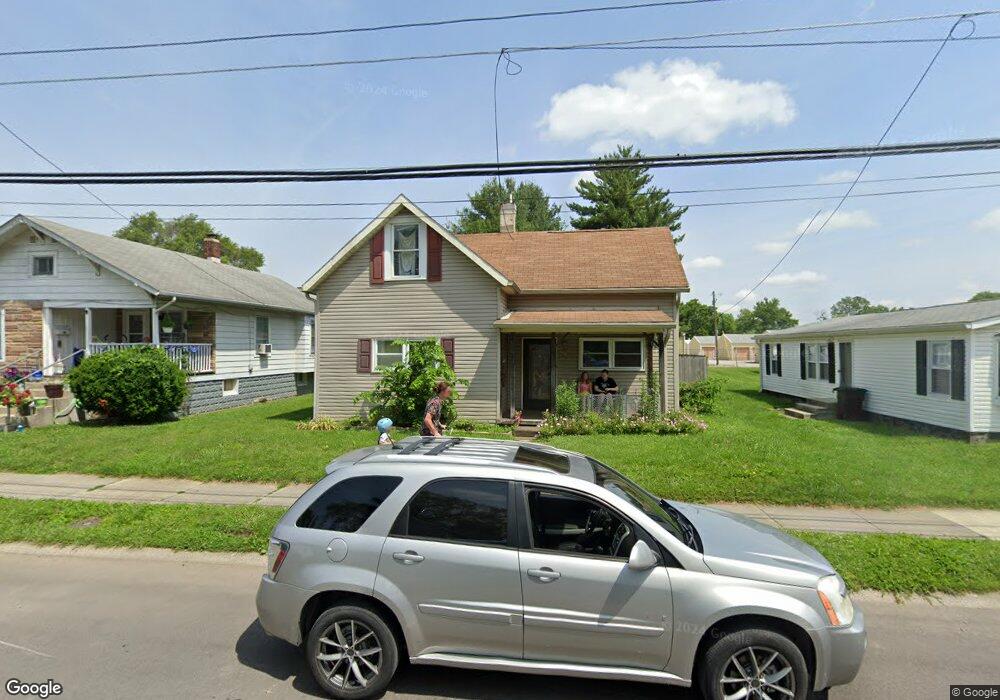
68 Mckinley St Shelbyville, IN 46176
Estimated Value: $173,000 - $177,000
3
Beds
2
Baths
1,858
Sq Ft
$95/Sq Ft
Est. Value
About This Home
This home is located at 68 Mckinley St, Shelbyville, IN 46176 and is currently estimated at $175,779, approximately $94 per square foot. 68 Mckinley St is a home located in Shelby County with nearby schools including William F. Loper Elementary School, Shelbyville Middle School, and Shelbyville Senior High School.
Ownership History
Date
Name
Owned For
Owner Type
Purchase Details
Closed on
Sep 8, 2014
Sold by
Mom & Dads Property Llc
Bought by
Lanning Joshua S and Lanning Jessica S
Current Estimated Value
Home Financials for this Owner
Home Financials are based on the most recent Mortgage that was taken out on this home.
Original Mortgage
$62,840
Outstanding Balance
$47,405
Interest Rate
3.75%
Mortgage Type
FHA
Estimated Equity
$128,374
Purchase Details
Closed on
Sep 16, 2013
Sold by
Haehl Paul and Haehl Carolyn
Bought by
Mom & Dads Property Llc
Purchase Details
Closed on
Sep 5, 2013
Sold by
Pogue Betty and Bank Of America Na
Bought by
Haehl Paul and Haehl Carolyn
Purchase Details
Closed on
Apr 15, 2009
Sold by
Washburn Roger D and Washburn Pamela S
Bought by
Pogue Thomas E and Pogue Betty A
Home Financials for this Owner
Home Financials are based on the most recent Mortgage that was taken out on this home.
Original Mortgage
$86,406
Interest Rate
5.19%
Mortgage Type
FHA
Create a Home Valuation Report for This Property
The Home Valuation Report is an in-depth analysis detailing your home's value as well as a comparison with similar homes in the area
Home Values in the Area
Average Home Value in this Area
Purchase History
| Date | Buyer | Sale Price | Title Company |
|---|---|---|---|
| Lanning Joshua S | -- | None Available | |
| Mom & Dads Property Llc | -- | None Available | |
| Haehl Paul | $25,561 | None Available | |
| Pogue Thomas E | -- | -- |
Source: Public Records
Mortgage History
| Date | Status | Borrower | Loan Amount |
|---|---|---|---|
| Open | Lanning Joshua S | $62,840 | |
| Previous Owner | Pogue Thomas E | $86,406 |
Source: Public Records
Tax History Compared to Growth
Tax History
| Year | Tax Paid | Tax Assessment Tax Assessment Total Assessment is a certain percentage of the fair market value that is determined by local assessors to be the total taxable value of land and additions on the property. | Land | Improvement |
|---|---|---|---|---|
| 2024 | $948 | $102,100 | $9,800 | $92,300 |
| 2023 | $852 | $98,600 | $9,800 | $88,800 |
| 2022 | $842 | $95,100 | $9,800 | $85,300 |
| 2021 | $729 | $88,200 | $9,800 | $78,400 |
| 2020 | $657 | $85,000 | $9,800 | $75,200 |
| 2019 | $686 | $86,300 | $9,000 | $77,300 |
| 2018 | $555 | $78,700 | $9,000 | $69,700 |
| 2017 | $742 | $89,100 | $9,000 | $80,100 |
| 2016 | $694 | $86,600 | $9,000 | $77,600 |
| 2014 | $965 | $99,100 | $9,000 | $90,100 |
| 2013 | $965 | $99,100 | $9,000 | $90,100 |
Source: Public Records
Map
Nearby Homes
- 41 Grissom Ln
- LT2 Hascuster Ln
- LT3 Hasecuster Ln
- LT4 Hasecuster Ln
- 1051 Meridian St
- 34 Mildred St
- 1617 S Riley Hwy
- 1625 S Riley Hwy
- 1103 Fairfield Dr
- 120 1st St
- 1101 S Shelby St
- 217 Howard St
- 410 Howard St
- 755 2nd St
- 700 E South St
- 629 S Miller St
- 814 Carlin Dr
- 430 W Locust St
- 842 Miller Ave
- 903 Governors Ln
- 72 Mckinley St
- 66 Mckinley St
- 52 Mckinley St
- 0 Mckinley St
- 76 Mckinley St
- 69 Mckinley St
- 61 Mckinley St
- 59 Mckinley St
- 71 Mckinley St
- 44 Mckinley St
- 57 Mckinley St
- 75 Mckinley St
- 46 Ash Ln
- 102 Mckinley St
- 55 Mckinley St
- 1325 & 1327 Jefferson Ave
- 1325 Jefferson Ave
- 1325 Jefferson Ave Unit A
- 42 Mckinley St
- 81 Mckinley St