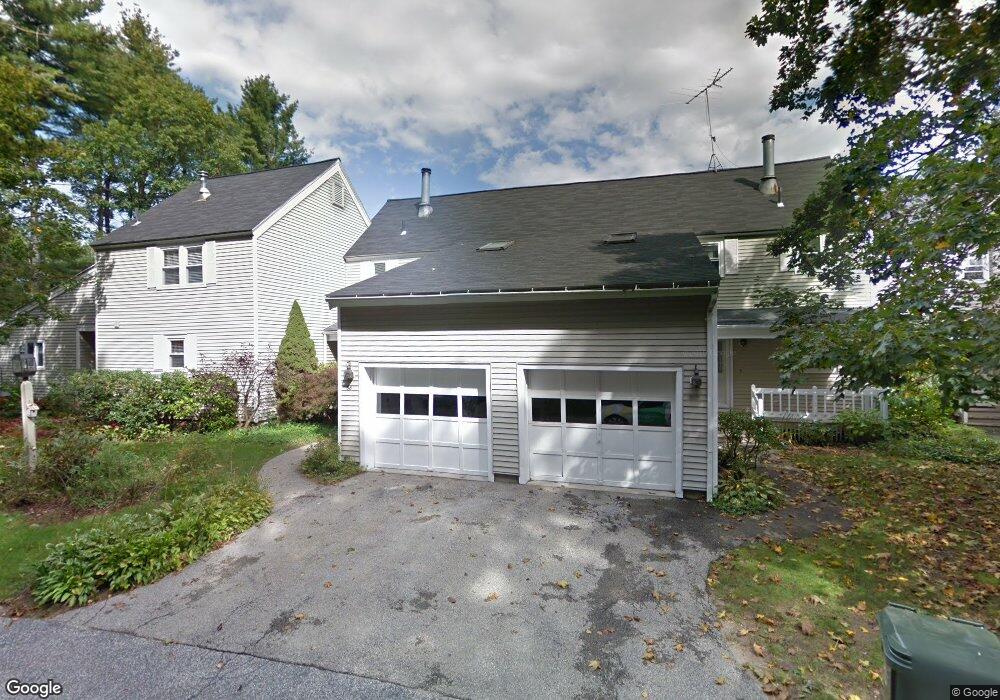
68 Winding Pond Rd Unit 68 Londonderry, NH 03053
Estimated Value: $425,000 - $441,000
3
Beds
3
Baths
1,970
Sq Ft
$219/Sq Ft
Est. Value
About This Home
This home is located at 68 Winding Pond Rd Unit 68, Londonderry, NH 03053 and is currently estimated at $430,672, approximately $218 per square foot. 68 Winding Pond Rd Unit 68 is a home located in Rockingham County with nearby schools including Londonderry Middle School, Londonderry Senior High School, and Southern New Hampshire Montessori Academy.
Ownership History
Date
Name
Owned For
Owner Type
Purchase Details
Closed on
Sep 12, 2025
Sold by
James B Ginnard Ret and Ginnard
Bought by
Zurakowski
Current Estimated Value
Purchase Details
Closed on
Aug 15, 2014
Sold by
Ginnard James B
Bought by
James B Ginnard Ret and Ginnard
Purchase Details
Closed on
Nov 14, 2011
Sold by
Conley John J
Bought by
Ginnard James B
Home Financials for this Owner
Home Financials are based on the most recent Mortgage that was taken out on this home.
Original Mortgage
$154,530
Interest Rate
4.01%
Mortgage Type
Purchase Money Mortgage
Purchase Details
Closed on
Apr 5, 2011
Sold by
Department Of Housing & Urban Dev
Bought by
Conley John J
Purchase Details
Closed on
May 5, 2010
Sold by
Gerard Gina and Flagstar Bank Fsb
Bought by
Flagstar Bank Fsb
Purchase Details
Closed on
Dec 26, 2002
Sold by
Johnston Mary W
Bought by
Fraser Gina
Create a Home Valuation Report for This Property
The Home Valuation Report is an in-depth analysis detailing your home's value as well as a comparison with similar homes in the area
Home Values in the Area
Average Home Value in this Area
Purchase History
| Date | Buyer | Sale Price | Title Company |
|---|---|---|---|
| Zurakowski | $427,533 | -- | |
| Zurakowski | $427,533 | -- | |
| Zurakowski | $427,533 | -- | |
| James B Ginnard Ret | -- | -- | |
| James B Ginnard Ret | -- | -- | |
| James B Ginnard Ret | -- | -- | |
| Ginnard James B | $180,000 | -- | |
| Ginnard James B | $180,000 | -- | |
| Conley John J | $108,000 | -- | |
| Conley John J | $108,000 | -- | |
| Flagstar Bank Fsb | $240,800 | -- | |
| Flagstar Bank Fsb | $240,800 | -- | |
| Fraser Gina | $178,000 | -- |
Source: Public Records
Mortgage History
| Date | Status | Borrower | Loan Amount |
|---|---|---|---|
| Previous Owner | Fraser Gina | $154,530 |
Source: Public Records
Tax History Compared to Growth
Tax History
| Year | Tax Paid | Tax Assessment Tax Assessment Total Assessment is a certain percentage of the fair market value that is determined by local assessors to be the total taxable value of land and additions on the property. | Land | Improvement |
|---|---|---|---|---|
| 2024 | $5,334 | $330,500 | $0 | $330,500 |
| 2023 | $5,172 | $330,500 | $0 | $330,500 |
| 2022 | $4,838 | $261,800 | $0 | $261,800 |
| 2021 | $4,812 | $261,800 | $0 | $261,800 |
| 2020 | $4,939 | $245,600 | $0 | $245,600 |
| 2019 | $4,762 | $245,600 | $0 | $245,600 |
| 2018 | $4,266 | $195,700 | $0 | $195,700 |
| 2017 | $4,229 | $195,700 | $0 | $195,700 |
| 2016 | $4,208 | $195,700 | $0 | $195,700 |
| 2015 | $4,114 | $195,700 | $0 | $195,700 |
| 2014 | $4,127 | $195,700 | $0 | $195,700 |
| 2011 | -- | $196,600 | $0 | $196,600 |
Source: Public Records
Map
Nearby Homes
- 47 Winding Pond Rd
- 214 Winding Pond Rd
- 111 Winterwood Dr
- 267 Winding Pond Rd
- 27 Midridge Cir
- 31 Midridge Cir
- 11 Midridge Cir Unit 116
- 107a Gilcreast Rd Unit A
- 40 Elise Ave Unit Lot 20
- 36 Elise Ave Unit Lot 18
- 1 Elise Ave Unit Lot 96
- 6 Sugar Plum Ln
- 7 Elise Ave Unit Lot 93
- 12 Morrison Dr
- 8 Elise Ave Unit Lot 4
- 14 Elise Ave Unit 7
- 12 Elise Ave Unit 6
- 3 Elise Ave Unit 95
- 14 Reed St
- 14 Mohawk Dr
- 69 Winding Pond Rd Unit 69
- 67 Winding Pond Rd
- 71 Winding Pond Rd
- 72 Winding Pond Rd Unit 72
- 64 Winding Pond Rd Unit 64
- 63 Winding Pond Rd Unit 63
- 62 Winding Pond Rd Unit 62
- 61 Winding Pond Rd
- 48 Winding Pond Rd
- 45 Winding Pond Rd
- 51 Winding Pond Rd
- 60 Winding Pond Rd
- 60 Winding Pond Rd Unit 60
- 43 Winding Pond Rd Unit 43
- 52 Winding Pond Rd Unit 52
- 41 Winding Pond Rd Unit 41
- 53 Winding Pond Rd Unit 53
- 54 Winding Pond Rd Unit 54
- 59 Winding Pond Rd
- 55 Winding Pond Rd Unit 55