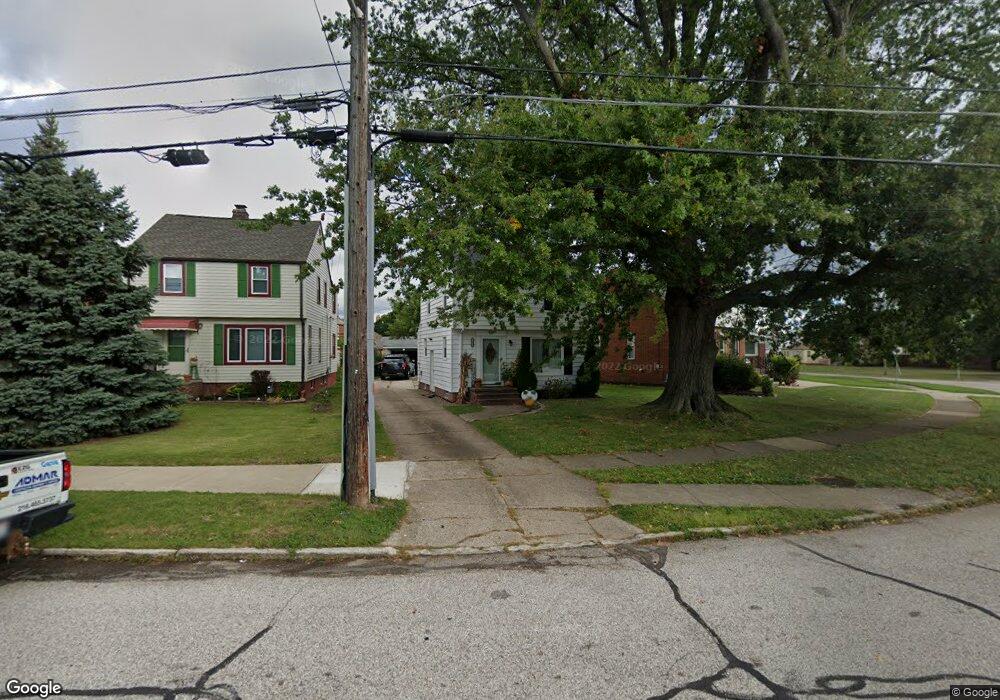
6806 Pelham Dr Cleveland, OH 44129
Estimated Value: $173,000 - $226,000
3
Beds
1
Bath
1,111
Sq Ft
$178/Sq Ft
Est. Value
About This Home
This home is located at 6806 Pelham Dr, Cleveland, OH 44129 and is currently estimated at $197,284, approximately $177 per square foot. 6806 Pelham Dr is a home located in Cuyahoga County with nearby schools including Renwood Elementary School, Thoreau Park Elementary School, and Shiloh Middle School.
Ownership History
Date
Name
Owned For
Owner Type
Purchase Details
Closed on
Apr 22, 2013
Sold by
Furry Brennan J and Furry Beth A
Bought by
Furry Brennan J and Furry Beth A
Current Estimated Value
Home Financials for this Owner
Home Financials are based on the most recent Mortgage that was taken out on this home.
Original Mortgage
$99,000
Outstanding Balance
$70,290
Interest Rate
3.6%
Mortgage Type
New Conventional
Estimated Equity
$126,994
Purchase Details
Closed on
Apr 27, 2004
Sold by
Genther Randy H and Schallhorn Frances L
Bought by
Furry Brennan J
Home Financials for this Owner
Home Financials are based on the most recent Mortgage that was taken out on this home.
Original Mortgage
$101,134
Interest Rate
5.05%
Mortgage Type
FHA
Purchase Details
Closed on
Oct 16, 1986
Sold by
Genther Henry J
Bought by
Genther Pauline L
Purchase Details
Closed on
Oct 20, 1977
Sold by
Genther Henry J and P L
Bought by
Genther Henry J
Purchase Details
Closed on
Jan 1, 1975
Bought by
Genther Henry J and P L
Create a Home Valuation Report for This Property
The Home Valuation Report is an in-depth analysis detailing your home's value as well as a comparison with similar homes in the area
Home Values in the Area
Average Home Value in this Area
Purchase History
| Date | Buyer | Sale Price | Title Company |
|---|---|---|---|
| Furry Brennan J | -- | Kingdom Title | |
| Furry Brennan J | $103,000 | Titlexperts Agency Inc | |
| Genther Pauline L | -- | -- | |
| Genther Henry J | -- | -- | |
| Genther Henry J | -- | -- |
Source: Public Records
Mortgage History
| Date | Status | Borrower | Loan Amount |
|---|---|---|---|
| Open | Furry Brennan J | $99,000 | |
| Previous Owner | Furry Brennan J | $101,134 |
Source: Public Records
Tax History Compared to Growth
Tax History
| Year | Tax Paid | Tax Assessment Tax Assessment Total Assessment is a certain percentage of the fair market value that is determined by local assessors to be the total taxable value of land and additions on the property. | Land | Improvement |
|---|---|---|---|---|
| 2024 | $3,470 | $55,895 | $10,640 | $45,255 |
| 2023 | $2,880 | $39,590 | $9,420 | $30,170 |
| 2022 | $2,852 | $39,590 | $9,420 | $30,170 |
| 2021 | $2,932 | $39,590 | $9,420 | $30,170 |
| 2020 | $2,575 | $30,450 | $7,250 | $23,210 |
| 2019 | $2,465 | $87,000 | $20,700 | $66,300 |
| 2018 | $2,478 | $30,450 | $7,250 | $23,210 |
| 2017 | $2,272 | $25,830 | $5,320 | $20,510 |
| 2016 | $2,258 | $25,830 | $5,320 | $20,510 |
| 2015 | $2,144 | $25,830 | $5,320 | $20,510 |
| 2014 | $2,144 | $26,360 | $5,430 | $20,930 |
Source: Public Records
Map
Nearby Homes
- 6111 Manchester Rd
- 6096 Wareham Dr
- 6701 Pelham Dr
- 6168 Manchester Rd
- 6610 Renwood Dr
- 6136 Ridge Rd
- 6227 Ridge Rd
- 6234 N Canterbury Rd
- 6708 Thornton Dr
- 7014 Thornton Dr
- 7503 Whittington Dr
- 6510 Belmere Dr
- 6298 Chestnut Hills Dr
- 7115 Hampstead Ave
- 6818 Hampstead Ave
- 6704 Charles Ave
- 5415 Pelham Dr
- 7514 Spring Garden Rd
- 5603 Allanwood Dr
- 8017 Wainstead Dr
- 6812 Pelham Dr
- 6160 Kelsey Rd
- 6818 Pelham Dr
- 6156 Kelsey Rd
- 6156 Kelsey Rd Unit Down
- 6156 Kelsey Rd Unit UP
- 6157 Wareham Dr
- 6822 Pelham Dr
- 6150 Kelsey Rd
- 6151 Wareham Dr
- 6151 Wareham Dr Unit UP
- 6151 Wareham Dr Unit 1
- 6151 Wareham Dr Unit 1/DN
- 6146 Kelsey Rd
- 6147 Wareham Dr
- 6803 Pelham Dr
- 6185 N Canterbury Rd
- 6711 Pelham Dr
- 6193 N Canterbury Rd
- 6700 Pelham Dr