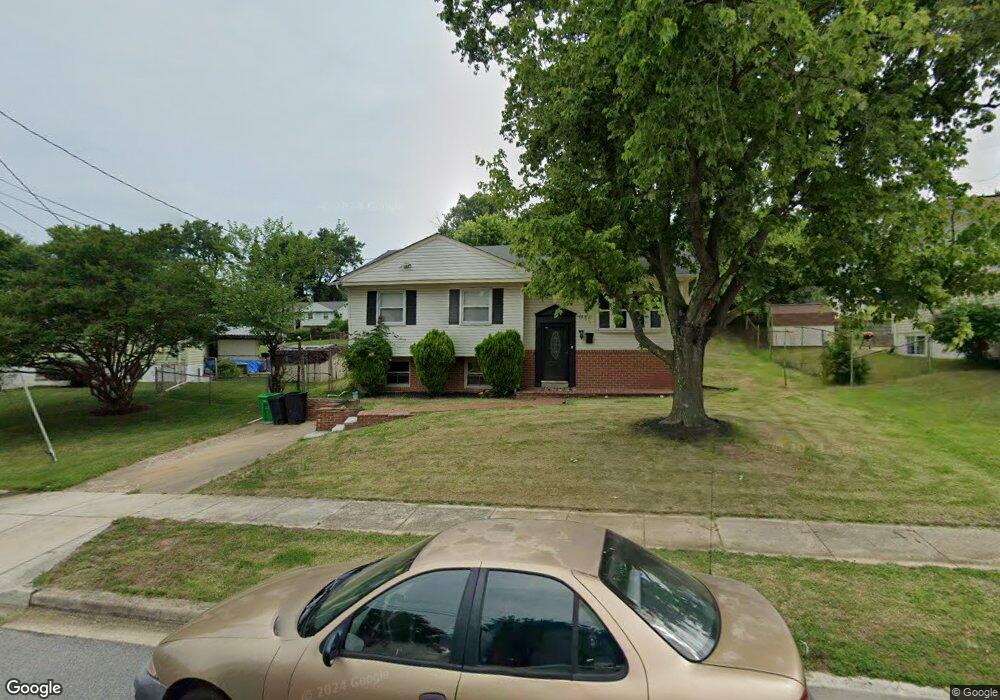
6810 Pepper St Capitol Heights, MD 20743
Estimated Value: $356,000 - $394,868
--
Bed
2
Baths
1,095
Sq Ft
$341/Sq Ft
Est. Value
About This Home
This home is located at 6810 Pepper St, Capitol Heights, MD 20743 and is currently estimated at $373,217, approximately $340 per square foot. 6810 Pepper St is a home located in Prince George's County with nearby schools including Carmody Hills Elementary School, G. James Gholson Middle School, and Central High School.
Ownership History
Date
Name
Owned For
Owner Type
Purchase Details
Closed on
May 14, 2021
Sold by
Roy Tammy Marie and Carter Tanya Maria
Bought by
Roy Tammy Marie and Carter Tanya Maria
Current Estimated Value
Home Financials for this Owner
Home Financials are based on the most recent Mortgage that was taken out on this home.
Original Mortgage
$213,300
Outstanding Balance
$192,273
Interest Rate
2.9%
Mortgage Type
New Conventional
Estimated Equity
$180,944
Purchase Details
Closed on
Jul 17, 2000
Sold by
Nichols Evelyn V
Bought by
Carter Tammy M and Carter Tonya M
Purchase Details
Closed on
Aug 22, 1996
Sold by
Robinson Evelyn V
Bought by
Nichols Evelyn V
Purchase Details
Closed on
Dec 20, 1983
Sold by
Coward Felix
Bought by
Robinson Evelyn and Robinson Thomas S
Create a Home Valuation Report for This Property
The Home Valuation Report is an in-depth analysis detailing your home's value as well as a comparison with similar homes in the area
Home Values in the Area
Average Home Value in this Area
Purchase History
| Date | Buyer | Sale Price | Title Company |
|---|---|---|---|
| Roy Tammy Marie | -- | Accommodation | |
| Carter Tammy M | $120,900 | -- | |
| Nichols Evelyn V | -- | -- | |
| Robinson Evelyn | $73,900 | -- |
Source: Public Records
Mortgage History
| Date | Status | Borrower | Loan Amount |
|---|---|---|---|
| Open | Roy Tammy Marie | $213,300 |
Source: Public Records
Tax History Compared to Growth
Tax History
| Year | Tax Paid | Tax Assessment Tax Assessment Total Assessment is a certain percentage of the fair market value that is determined by local assessors to be the total taxable value of land and additions on the property. | Land | Improvement |
|---|---|---|---|---|
| 2025 | $5,285 | $356,800 | -- | -- |
| 2024 | $5,285 | $328,800 | $0 | $0 |
| 2023 | $4,868 | $300,800 | $80,800 | $220,000 |
| 2022 | $4,531 | $278,133 | $0 | $0 |
| 2021 | $4,194 | $255,467 | $0 | $0 |
| 2020 | $3,857 | $232,800 | $45,400 | $187,400 |
| 2019 | $3,302 | $230,600 | $0 | $0 |
| 2018 | $3,775 | $228,400 | $0 | $0 |
| 2017 | $3,399 | $226,200 | $0 | $0 |
| 2016 | -- | $201,967 | $0 | $0 |
| 2015 | $2,878 | $177,733 | $0 | $0 |
| 2014 | $2,878 | $153,500 | $0 | $0 |
Source: Public Records
Map
Nearby Homes
- 117 Pepper Mill Dr
- 6913 Canyon Dr
- 6610 Arlene Dr
- 6609 Clinglog St
- 6708 Clinglog St
- 6905 Drylog St
- 6604 Valley Park Rd
- 8 Cindy Ln
- 600 Goldleaf Ave
- 6706 Central Ave
- 304 Cedarleaf Ave
- 611 Fernleaf Ave
- 6610 Central Ave
- 418 Cedarleaf Ave
- 6509 Seat Pleasant Dr
- 803 Booker Dr
- 0 Central Ave
- 7214 G St
- 6512 Rolling Ridge Dr
- 0 Central Ave Unit MDPG2184114