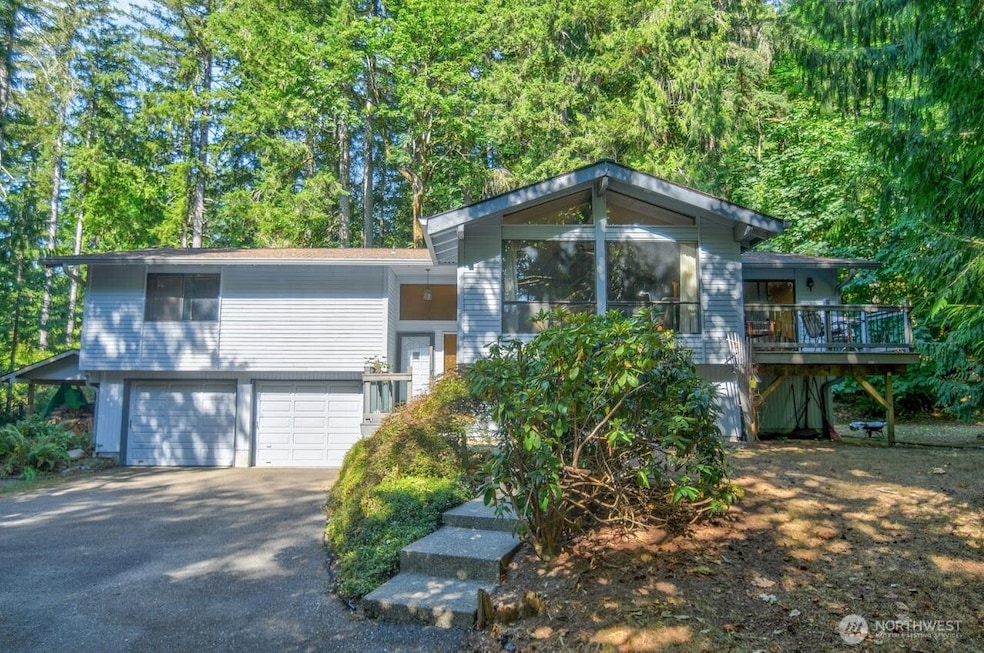
6819 Northill Dr SW Olympia, WA 98512
Estimated payment $3,358/month
About This Home
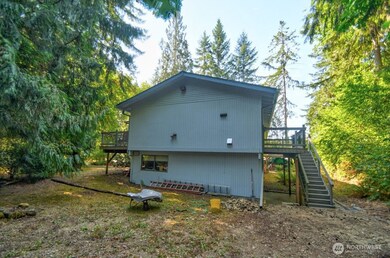
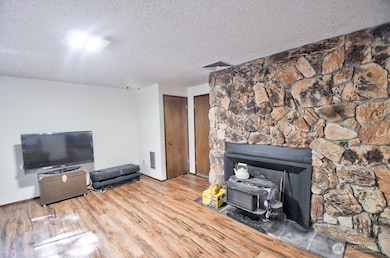
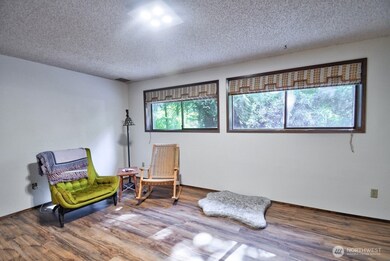
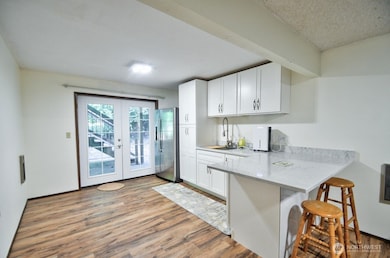
Spacious split entry home that's perfect for multigenerational living. Over 2,600 square feet, 4 bedrooms, 2.75 baths on almost one acre. Oversized attached two car garage, large decks on front and back of home to enjoy beautiful territorial views. Community park and multiple walking trails throughout the neighborhood. Near Black Lake, Delphi Golf Course and Capital Forest. Community water and septic to help avoid those growing utility prices. Come view your new home today!
Listing Agent
Century Realtors
Century 21 Lund, Realtors Listed on: 08/05/2025

Home Details
Home Type
- Single Family
Est. Annual Taxes
- $5,855
Bedrooms and Bathrooms
- 4 Bedrooms
- 2 Full Bathrooms
Additional Features
- On Golf Course
- Co-Op Water
Community Details
- Golf Course Community
Map
Home Values in the Area
Average Home Value in this Area
Tax History
| Year | Tax Paid | Tax Assessment Tax Assessment Total Assessment is a certain percentage of the fair market value that is determined by local assessors to be the total taxable value of land and additions on the property. | Land | Improvement |
|---|---|---|---|---|
| 2024 | $5,855 | $580,200 | $199,800 | $380,400 |
| 2023 | $5,855 | $530,800 | $173,200 | $357,600 |
| 2022 | $5,473 | $528,900 | $123,600 | $405,300 |
| 2021 | $5,045 | $439,400 | $106,300 | $333,100 |
| 2020 | $4,793 | $365,300 | $103,000 | $262,300 |
| 2019 | $4,711 | $338,000 | $84,800 | $253,200 |
| 2018 | $4,187 | $307,300 | $72,900 | $234,400 |
| 2017 | $3,896 | $277,750 | $70,650 | $207,100 |
| 2016 | $4,241 | $261,050 | $61,750 | $199,300 |
| 2014 | -- | $300,750 | $65,950 | $234,800 |
Property History
| Date | Event | Price | List to Sale | Price per Sq Ft |
|---|---|---|---|---|
| 08/25/2025 08/25/25 | Price Changed | $545,000 | -2.5% | $207 / Sq Ft |
| 08/04/2025 08/04/25 | For Sale | $559,000 | -- | $213 / Sq Ft |
- 0 Brown Rd SW
- 7844 Delphi Rd SW
- 6001 Capitol Forest Ct SW
- 6002 Capitol Forest Ct SW
- 5336 75th Ct SW
- 7524 Greenridge St SW
- 7408 Mazama St SW
- 5325 79th Ct SW
- 5205 59th Ct SW
- 7734 Greenridge St SW
- 7615 Sprucecrest St SW
- 7620 Sprucecrest St SW
- 7207 Lakeside St SW
- 8747 Laguna Dr SW
- 5206 81st Ave SW
- 7123 Lakeside St SW
- 7605 Lakeside St SW
- 7609 Lakeside St SW
- 8107 Mazama Ct SW
- 6109 Guerin St SW
- 5004 Fourth Way SW
- 1978 Trosper Rd SW
- 4701 7th Ave SW
- 4822 Rural Rd SW
- 1900 Black Lake Blvd SW
- 1517 Bishop Rd SW
- 1450 Odegard Rd SW
- 6705 Linderson Way SW
- 4125 Capital Mall Dr SW
- 800 Yauger Way SW
- 1653 Starlight Ln SW
- 3311 6th Ave SW
- 1923 Brittany Ln SW
- 301 T St SW
- 320 Israel Rd SW
- 1704 Barnes Blvd SW
- 215 Pinehurst Dr SW
- 6029 Capitol Blvd S
- 1221 Mottman Rd SW
- 2323 9th Ave SW