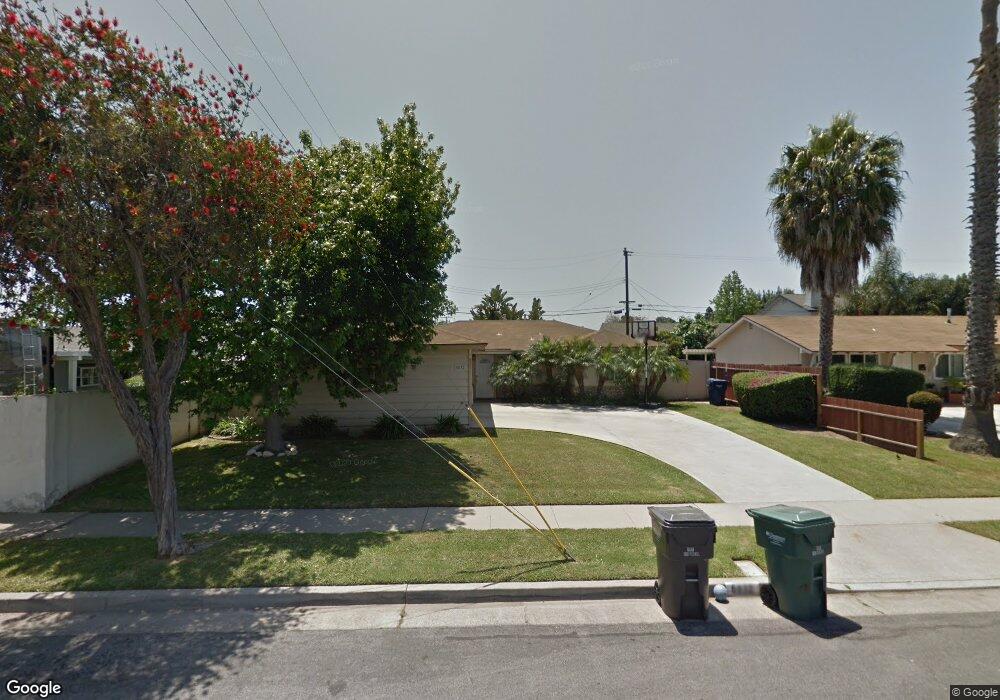
6832 Bonnie Dr Huntington Beach, CA 92647
Estimated Value: $1,088,531 - $1,212,000
3
Beds
2
Baths
1,240
Sq Ft
$929/Sq Ft
Est. Value
About This Home
This home is located at 6832 Bonnie Dr, Huntington Beach, CA 92647 and is currently estimated at $1,152,133, approximately $929 per square foot. 6832 Bonnie Dr is a home located in Orange County with nearby schools including College View Elementary School, Spring View Middle School, and Ocean View High.
Ownership History
Date
Name
Owned For
Owner Type
Purchase Details
Closed on
Sep 13, 2016
Sold by
Alstrup Dean L
Bought by
Alstrup Dean Lund and The Dean Lund Alstrup Living Trust
Current Estimated Value
Purchase Details
Closed on
Jun 9, 2012
Sold by
Alstrup Danelle E
Bought by
Alstrup Dean L
Purchase Details
Closed on
May 7, 2002
Sold by
Alstrup Dean Lund
Bought by
Alstrup Dean and Alstrup Danelle
Home Financials for this Owner
Home Financials are based on the most recent Mortgage that was taken out on this home.
Original Mortgage
$225,000
Interest Rate
7.18%
Purchase Details
Closed on
Jan 24, 1994
Sold by
Jones Glenn W
Bought by
Alstrup Dean Lund
Home Financials for this Owner
Home Financials are based on the most recent Mortgage that was taken out on this home.
Original Mortgage
$167,200
Interest Rate
7%
Create a Home Valuation Report for This Property
The Home Valuation Report is an in-depth analysis detailing your home's value as well as a comparison with similar homes in the area
Home Values in the Area
Average Home Value in this Area
Purchase History
| Date | Buyer | Sale Price | Title Company |
|---|---|---|---|
| Alstrup Dean Lund | -- | None Available | |
| Alstrup Dean L | -- | None Available | |
| Alstrup Dean | -- | North American Title Co | |
| Alstrup Dean Lund | $176,000 | Fidelity National Title Ins |
Source: Public Records
Mortgage History
| Date | Status | Borrower | Loan Amount |
|---|---|---|---|
| Closed | Alstrup Dean | $225,000 | |
| Closed | Alstrup Dean Lund | $167,200 |
Source: Public Records
Tax History Compared to Growth
Tax History
| Year | Tax Paid | Tax Assessment Tax Assessment Total Assessment is a certain percentage of the fair market value that is determined by local assessors to be the total taxable value of land and additions on the property. | Land | Improvement |
|---|---|---|---|---|
| 2025 | $3,603 | $299,129 | $217,565 | $81,564 |
| 2024 | $3,603 | $293,264 | $213,299 | $79,965 |
| 2023 | $3,520 | $287,514 | $209,116 | $78,398 |
| 2022 | $3,465 | $281,877 | $205,016 | $76,861 |
| 2021 | $3,403 | $276,350 | $200,996 | $75,354 |
| 2020 | $3,365 | $273,517 | $198,935 | $74,582 |
| 2019 | $3,310 | $268,154 | $195,034 | $73,120 |
| 2018 | $3,238 | $262,897 | $191,210 | $71,687 |
| 2017 | $3,187 | $257,743 | $187,461 | $70,282 |
| 2016 | $3,062 | $252,690 | $183,786 | $68,904 |
| 2015 | $3,016 | $248,895 | $181,026 | $67,869 |
| 2014 | $2,957 | $244,020 | $177,480 | $66,540 |
Source: Public Records
Map
Nearby Homes
- 16722 Goldenwest St
- 7002 Valentine Dr
- 16531 Sabot Ln
- 16542 Sabot Ln
- 16401 Serenade Ln
- 7248 Aura Cir
- 7252 Ellington Dr
- 7231 Alchemy Cir
- 7223 Alchemy Cir
- 7264 Aura Cir
- 7272 Ellington Dr
- 16381 Magellan Ln
- 16892 Limelight Cir Unit B
- 6672 Sun Dr Unit B
- 6351 Gloria Dr
- 16081 Windemeir Ln
- 7252 Elk Cir
- 6292 Heil Ave
- 6600 Warner Ave Unit 50
- 6600 Warner Ave
- 6822 Bonnie Dr
- 16531 Kettler Ln
- 16551 Kettler Ln
- 16562 Simmone Ln
- 6802 Bonnie Dr
- 16561 Kettler Ln
- 16572 Simonne Ln
- 16572 Simmone Ln
- 6831 Bonnie Dr
- 6821 Bonnie Dr
- 16561 Simonne Ln
- 16561 Simmone Ln
- 6841 Bonnie Dr
- 6801 Bonnie Dr
- 16571 Kettler Ln
- 6792 Bonnie Dr
- 6851 Bonnie Dr
- 6791 Bonnie Dr
- 16592 Simonne Ln
- 16592 Simmone Ln