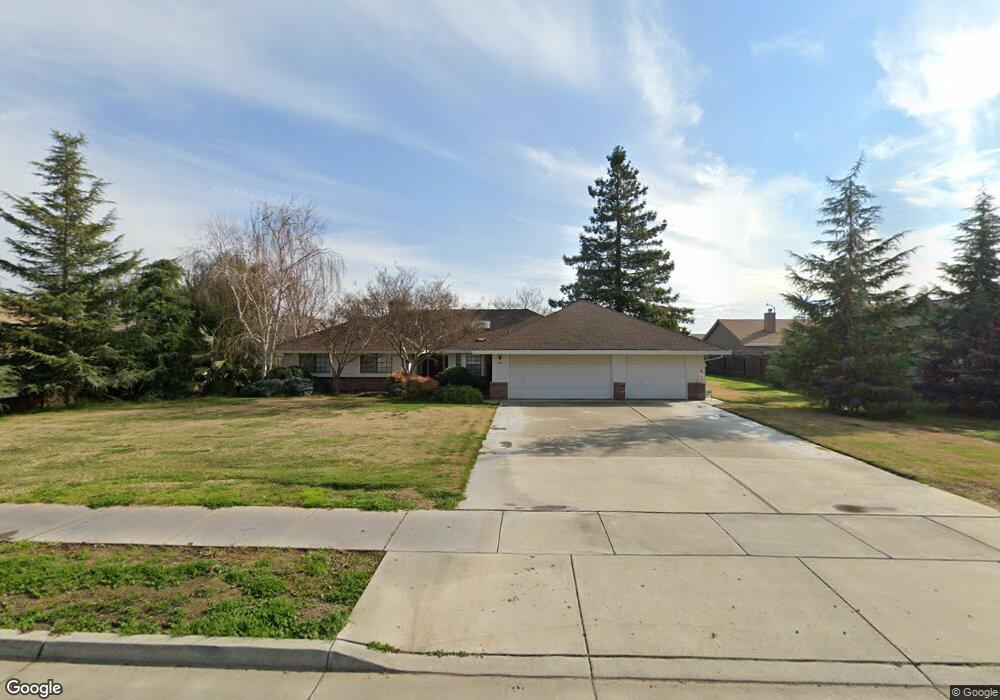
684 Sanborn Rd Yuba City, CA 95993
Estimated Value: $248,000 - $488,304
3
Beds
3
Baths
2,096
Sq Ft
$184/Sq Ft
Est. Value
About This Home
This home is located at 684 Sanborn Rd, Yuba City, CA 95993 and is currently estimated at $386,076, approximately $184 per square foot. 684 Sanborn Rd is a home located in Sutter County with nearby schools including Lincoln Elementary School, Yuba City High School, and St. Isidore Catholic School.
Ownership History
Date
Name
Owned For
Owner Type
Purchase Details
Closed on
Sep 22, 2022
Sold by
Dimitri J Karnegis & Eleni A Karnegis 20
Bought by
Eleni A Karnegis Revocable Trust
Current Estimated Value
Purchase Details
Closed on
Jan 22, 2010
Sold by
Eag Investments Llc and Karnegis Dimitri J
Bought by
Karnegis Dimitri J and Karnegis Eleni A
Purchase Details
Closed on
Jan 5, 2009
Sold by
Eagle Lane Of Stanford Llc
Bought by
Eag Investments Llc
Purchase Details
Closed on
Feb 1, 2005
Sold by
Lanza David W
Bought by
Eagle Lane Of Stanford Llc
Purchase Details
Closed on
Jan 7, 2004
Sold by
Karnegis Dimitri J and Karnegis Eleni A
Bought by
Valley Development Co Inc
Home Financials for this Owner
Home Financials are based on the most recent Mortgage that was taken out on this home.
Original Mortgage
$3,670,000
Interest Rate
5.88%
Mortgage Type
Construction
Create a Home Valuation Report for This Property
The Home Valuation Report is an in-depth analysis detailing your home's value as well as a comparison with similar homes in the area
Home Values in the Area
Average Home Value in this Area
Purchase History
| Date | Buyer | Sale Price | Title Company |
|---|---|---|---|
| Eleni A Karnegis Revocable Trust | -- | -- | |
| Karnegis Dimitri J | -- | None Available | |
| Eag Investments Llc | $2,879,277 | First American Title Company | |
| Eagle Lane Of Stanford Llc | $1,040,000 | North State Title Company | |
| Valley Development Co Inc | $2,322,000 | First American Title Co | |
| Lanza David W | $78,500 | First American Title Co |
Source: Public Records
Mortgage History
| Date | Status | Borrower | Loan Amount |
|---|---|---|---|
| Previous Owner | Valley Development Co Inc | $3,670,000 |
Source: Public Records
Tax History Compared to Growth
Tax History
| Year | Tax Paid | Tax Assessment Tax Assessment Total Assessment is a certain percentage of the fair market value that is determined by local assessors to be the total taxable value of land and additions on the property. | Land | Improvement |
|---|---|---|---|---|
| 2025 | $2,302 | $171,601 | $3,715 | $167,886 |
| 2024 | $2,302 | $168,238 | $3,643 | $164,595 |
| 2023 | $2,302 | $164,940 | $3,572 | $161,368 |
| 2022 | $2,165 | $161,706 | $3,502 | $158,204 |
| 2021 | $2,106 | $158,587 | $3,462 | $155,125 |
| 2020 | $2,081 | $156,961 | $3,427 | $153,534 |
| 2019 | $2,016 | $153,883 | $3,360 | $150,523 |
| 2018 | $1,948 | $150,866 | $3,294 | $147,572 |
| 2017 | $1,902 | $147,907 | $3,229 | $144,678 |
| 2016 | $1,870 | $145,007 | $3,166 | $141,841 |
| 2015 | $1,849 | $142,828 | $3,118 | $139,710 |
| 2014 | $1,815 | $140,031 | $3,057 | $136,974 |
Source: Public Records
Map
Nearby Homes
- 2185 Lincoln Rd
- 1105 Johnathan Dr
- 2038 Nicholas Dr
- 1180 Sanborn Rd
- 238 Anita Way
- 1150 Pico Ct
- 1955 Jason Ct
- 156 Bristol Way
- 1372 Johnathan Dr
- 1665 Michelle Dr
- 152 College Hill Way
- 170 Nantucket Way
- 1571 Holly Tree Dr
- 138 Nantucket Way
- 1515 Jodi Dr
- 1545 Camino Del Oro
- 1524 Spyglass Dr
- 1781 Franklin Rd Unit 36
- 1421 Richland Rd
- 1181 Robert Dr