Estimated Value: $900,000 - $978,000
4
Beds
3
Baths
2,171
Sq Ft
$432/Sq Ft
Est. Value
About This Home
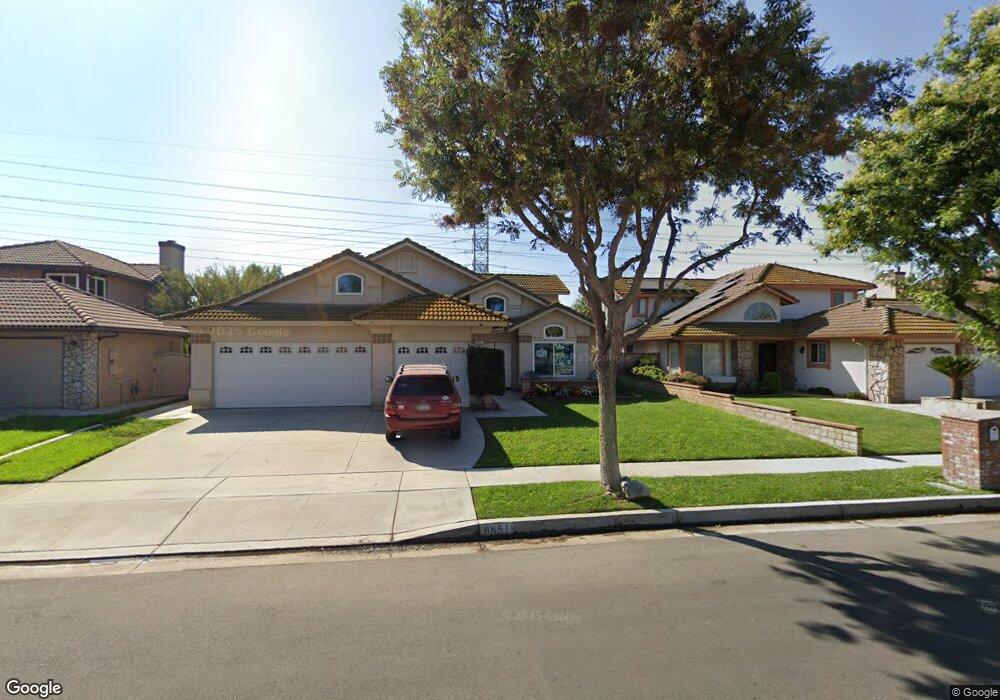
This home is located at 6851 Laurel Ct, Chino, CA 91710 and is currently estimated at $936,968, approximately $431 per square foot. 6851 Laurel Ct is a home located in San Bernardino County with nearby schools including Edwin Rhodes Elementary, Magnolia Junior High, and Chino High School.
Ownership History
Date
Name
Owned For
Owner Type
Purchase Details
Closed on
Feb 10, 1998
Sold by
Pham Paul V and Nguyen Thao T
Bought by
Pierce Martin R and Pierce Maricela G
Current Estimated Value
Home Financials for this Owner
Home Financials are based on the most recent Mortgage that was taken out on this home.
Original Mortgage
$173,850
Outstanding Balance
$30,749
Interest Rate
6.99%
Estimated Equity
$906,219
Purchase Details
Closed on
Jul 31, 1995
Sold by
Bosman David Richard and Bosman Maria Alice
Bought by
Pham Paul V and Nguyen Thao T
Home Financials for this Owner
Home Financials are based on the most recent Mortgage that was taken out on this home.
Original Mortgage
$118,300
Interest Rate
7.58%
Purchase Details
Closed on
Aug 31, 1993
Sold by
Van Daele Development Corp
Bought by
Bosman David Richard and Bosman Marie Alice
Home Financials for this Owner
Home Financials are based on the most recent Mortgage that was taken out on this home.
Original Mortgage
$184,000
Interest Rate
7.21%
Mortgage Type
Assumption
Create a Home Valuation Report for This Property
The Home Valuation Report is an in-depth analysis detailing your home's value as well as a comparison with similar homes in the area
Home Values in the Area
Average Home Value in this Area
Purchase History
| Date | Buyer | Sale Price | Title Company |
|---|---|---|---|
| Pierce Martin R | $183,000 | Old Republic Title Company | |
| Pham Paul V | $182,000 | First American Title Ins Co | |
| Bosman David Richard | $187,000 | First American Title Insuran |
Source: Public Records
Mortgage History
| Date | Status | Borrower | Loan Amount |
|---|---|---|---|
| Open | Pierce Martin R | $173,850 | |
| Previous Owner | Pham Paul V | $118,300 | |
| Previous Owner | Bosman David Richard | $184,000 |
Source: Public Records
Tax History Compared to Growth
Tax History
| Year | Tax Paid | Tax Assessment Tax Assessment Total Assessment is a certain percentage of the fair market value that is determined by local assessors to be the total taxable value of land and additions on the property. | Land | Improvement |
|---|---|---|---|---|
| 2025 | $3,558 | $317,675 | $71,801 | $245,874 |
| 2024 | $3,558 | $311,446 | $70,393 | $241,053 |
| 2023 | $3,463 | $305,339 | $69,013 | $236,326 |
| 2022 | $3,442 | $299,352 | $67,660 | $231,692 |
| 2021 | $3,377 | $293,482 | $66,333 | $227,149 |
| 2020 | $3,335 | $290,473 | $65,653 | $224,820 |
| 2019 | $3,279 | $284,778 | $64,366 | $220,412 |
| 2018 | $3,209 | $279,194 | $63,104 | $216,090 |
| 2017 | $3,153 | $273,720 | $61,867 | $211,853 |
| 2016 | $2,957 | $268,353 | $60,654 | $207,699 |
| 2015 | $2,632 | $238,713 | $59,743 | $178,970 |
| 2014 | $2,582 | $234,037 | $58,573 | $175,464 |
Source: Public Records
Map
Nearby Homes
- 6952 Silverado St
- 13846 Farmhouse Ave
- 6594 Manzanita Ct
- 6570 Encina St
- 13775 Harvard Ave
- 14170 Durazno Ave
- 13462 Mashona Ave
- 13360 Goldmedal Ave
- 6956 Dublin Dr
- 14380 Belhaven Ave
- 14349 Guilford Ave
- 14134 Mountain Ave
- 13255 Copra Ave
- 6685 Eucalyptus Ave
- 6641 Eucalyptus Ave
- 6501 Wheaton St
- 6550 Eucalyptus Ave
- 6212 Athena St
- 6599 Eucalyptus Ave
- 11610 Granville Place
- 6841 Laurel Ct
- 6831 Laurel Ct
- 6871 Laurel Ct
- 13875 Dogwood Ave
- 6821 Laurel Ct
- 13880 Cherry Ave
- 6881 Laurel Ct
- 13867 Dogwood Ave
- 6811 Laurel Ct
- 13872 Cherry Ave
- 13884 Dogwood Ave
- 13885 Cherry Ave
- 13859 Dogwood Ave
- 13876 Dogwood Ave
- 6801 Laurel Ct
- 13877 Cherry Ave
- 13864 Cherry Ave
- 13868 Dogwood Ave
- 13869 Cherry Ave
- 13851 Dogwood Ave