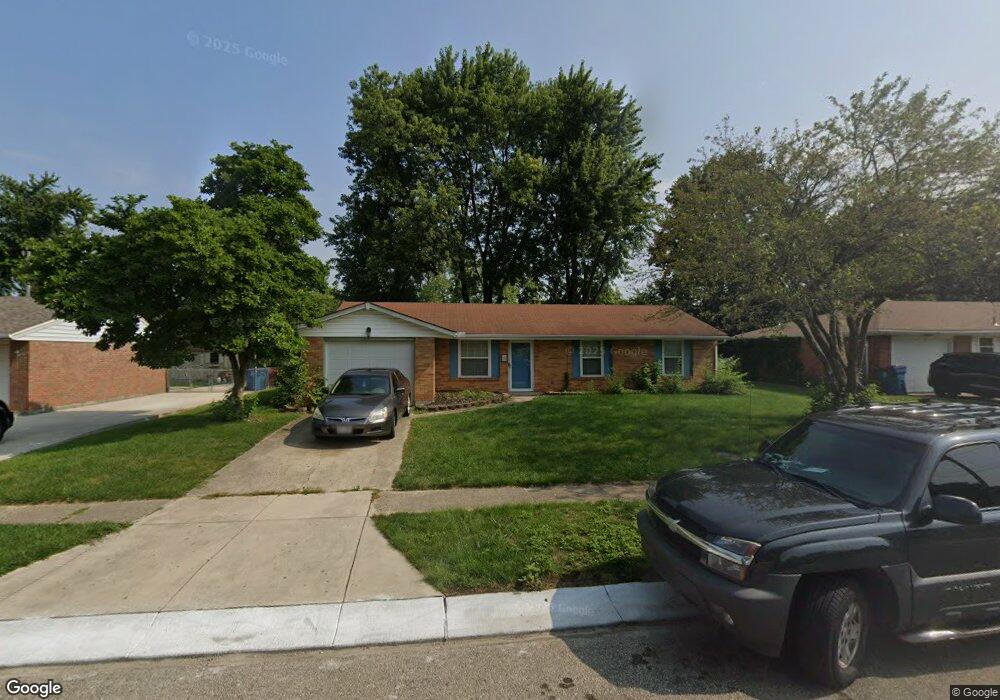
6857 Pablo Dr Dayton, OH 45424
Estimated Value: $192,000 - $206,000
3
Beds
2
Baths
1,170
Sq Ft
$169/Sq Ft
Est. Value
About This Home
This home is located at 6857 Pablo Dr, Dayton, OH 45424 and is currently estimated at $197,994, approximately $169 per square foot. 6857 Pablo Dr is a home located in Montgomery County with nearby schools including Wayne High School and Huber Heights Christian Academy.
Ownership History
Date
Name
Owned For
Owner Type
Purchase Details
Closed on
Aug 21, 2022
Sold by
Jl & Rw Properties Llc
Bought by
Lamb Rudolph Gilbert
Current Estimated Value
Home Financials for this Owner
Home Financials are based on the most recent Mortgage that was taken out on this home.
Original Mortgage
$153,000
Outstanding Balance
$145,932
Interest Rate
5.22%
Mortgage Type
New Conventional
Estimated Equity
$52,062
Purchase Details
Closed on
Jan 6, 2017
Sold by
Lanning Jason L
Bought by
Jl & Rw Properties Llc
Purchase Details
Closed on
Nov 28, 2007
Sold by
Lanning Christy L
Bought by
Lanning Jason
Purchase Details
Closed on
Mar 28, 2001
Sold by
Burrowes Janetta L and Burrowes Janetta L
Bought by
Lanning Jason L and Lanning Christy L
Home Financials for this Owner
Home Financials are based on the most recent Mortgage that was taken out on this home.
Original Mortgage
$88,100
Interest Rate
7.02%
Mortgage Type
FHA
Purchase Details
Closed on
Mar 24, 1997
Sold by
Burrowes James E
Bought by
Burrowes Janetta L
Create a Home Valuation Report for This Property
The Home Valuation Report is an in-depth analysis detailing your home's value as well as a comparison with similar homes in the area
Home Values in the Area
Average Home Value in this Area
Purchase History
| Date | Buyer | Sale Price | Title Company |
|---|---|---|---|
| Lamb Rudolph Gilbert | $170,000 | Vantage Land Title | |
| Jl & Rw Properties Llc | -- | -- | |
| Lanning Jason | $5,000 | None Available | |
| Lanning Jason L | $89,500 | -- | |
| Burrowes Janetta L | -- | -- |
Source: Public Records
Mortgage History
| Date | Status | Borrower | Loan Amount |
|---|---|---|---|
| Open | Lamb Rudolph Gilbert | $153,000 | |
| Previous Owner | Lanning Jason L | $88,100 |
Source: Public Records
Tax History Compared to Growth
Tax History
| Year | Tax Paid | Tax Assessment Tax Assessment Total Assessment is a certain percentage of the fair market value that is determined by local assessors to be the total taxable value of land and additions on the property. | Land | Improvement |
|---|---|---|---|---|
| 2024 | $2,390 | $46,210 | $10,150 | $36,060 |
| 2023 | $2,390 | $46,210 | $10,150 | $36,060 |
| 2022 | $2,140 | $31,840 | $7,000 | $24,840 |
| 2021 | $2,175 | $31,840 | $7,000 | $24,840 |
| 2020 | $2,177 | $31,840 | $7,000 | $24,840 |
| 2019 | $2,166 | $28,020 | $7,000 | $21,020 |
| 2018 | $2,173 | $28,020 | $7,000 | $21,020 |
| 2017 | $2,161 | $28,020 | $7,000 | $21,020 |
| 2016 | $2,004 | $25,980 | $7,000 | $18,980 |
| 2015 | $1,978 | $25,980 | $7,000 | $18,980 |
| 2014 | $1,978 | $25,980 | $7,000 | $18,980 |
| 2012 | -- | $26,590 | $8,750 | $17,840 |
Source: Public Records
Map
Nearby Homes
- 7741 Shalamar Dr
- 7660 Stonecrest Dr
- 6681 Spokane Dr
- 6701 Springport Way
- 7211 Stonehurst Dr
- 7611 Shepherdess Dr
- 7221 Serpentine Dr
- 7011 Safari Dr
- 6652 Loblolly Dr
- 6960 Serene Place
- 8282 Briar Ridge Ct
- 7866 Harshmanville Rd
- 6605 Highbury Rd
- 7854 Harshmanville Rd
- 7061 Rio Vista Ct
- 7833 Harshmanville Rd
- 6811 Highbury Rd
- 7371 Damascus Dr
- 6334 Shull Rd
- 6809 Casa Grande Ct
- 6871 Pablo Dr
- 6843 Pablo Dr
- 6860 Stonehurst Dr
- 6850 Stonehurst Dr
- 6870 Stonehurst Dr
- 6829 Pablo Dr
- 6887 Pablo Dr
- 6856 Pablo Dr
- 6842 Pablo Dr
- 6870 Pablo Dr
- 6840 Stonehurst Dr
- 6880 Stonehurst Dr
- 6815 Pablo Dr
- 6886 Pablo Dr
- 6820 Stonehurst Dr
- 6814 Pablo Dr
- 7819 Sebring Dr
- 6851 Stonehurst Dr
- 6865 Stonehurst Dr
- 7827 Sebring Dr