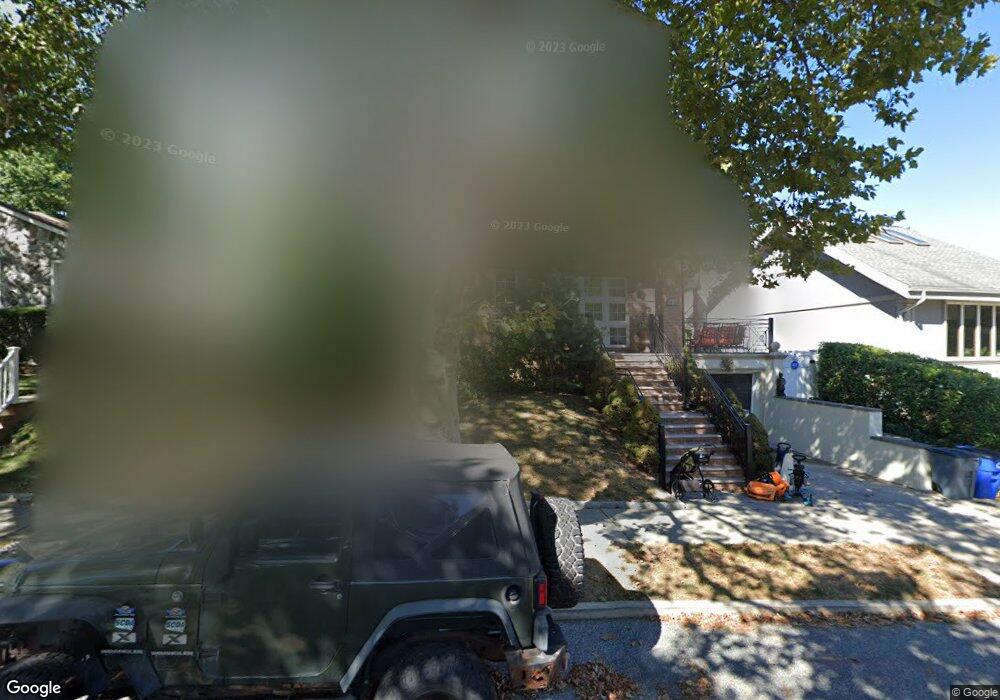
69-25 260th Place Glen Oaks, NY 11004
Glen Oaks NeighborhoodEstimated Value: $1,994,000 - $2,323,473
5
Beds
5
Baths
3,800
Sq Ft
$565/Sq Ft
Est. Value
About This Home
This home is located at 69-25 260th Place, Glen Oaks, NY 11004 and is currently estimated at $2,145,158, approximately $564 per square foot. 69-25 260th Place is a home located in Queens County with nearby schools including P.S. 186 Castlewood, Fremont/Hay Elementary School, and Irwin Altman Middle School 172.
Ownership History
Date
Name
Owned For
Owner Type
Purchase Details
Closed on
Nov 19, 2008
Sold by
Savani Manish S and Savani Usha M
Bought by
Gavlin Anna and Gavlin Nataliya I
Current Estimated Value
Home Financials for this Owner
Home Financials are based on the most recent Mortgage that was taken out on this home.
Original Mortgage
$417,000
Outstanding Balance
$271,861
Interest Rate
6.11%
Mortgage Type
Purchase Money Mortgage
Estimated Equity
$1,873,297
Purchase Details
Closed on
May 11, 2006
Sold by
Wan David and Wan Jenny
Bought by
Savani Manish S and Savani Usha M
Home Financials for this Owner
Home Financials are based on the most recent Mortgage that was taken out on this home.
Original Mortgage
$559,440
Interest Rate
6.71%
Mortgage Type
Purchase Money Mortgage
Create a Home Valuation Report for This Property
The Home Valuation Report is an in-depth analysis detailing your home's value as well as a comparison with similar homes in the area
Home Values in the Area
Average Home Value in this Area
Purchase History
| Date | Buyer | Sale Price | Title Company |
|---|---|---|---|
| Gavlin Anna | $980,000 | -- | |
| Gavlin Anna | $980,000 | -- | |
| Savani Manish S | $699,300 | -- | |
| Savani Manish S | $699,300 | -- |
Source: Public Records
Mortgage History
| Date | Status | Borrower | Loan Amount |
|---|---|---|---|
| Open | Gavlin Anna | $417,000 | |
| Closed | Gavlin Anna | $417,000 | |
| Previous Owner | Savani Manish S | $559,440 |
Source: Public Records
Tax History Compared to Growth
Tax History
| Year | Tax Paid | Tax Assessment Tax Assessment Total Assessment is a certain percentage of the fair market value that is determined by local assessors to be the total taxable value of land and additions on the property. | Land | Improvement |
|---|---|---|---|---|
| 2025 | $15,448 | $78,278 | $21,206 | $57,072 |
| 2024 | $15,448 | $76,913 | $22,877 | $54,036 |
| 2023 | $14,573 | $72,559 | $22,045 | $50,514 |
| 2022 | $14,100 | $112,500 | $34,800 | $77,700 |
| 2021 | $14,552 | $93,240 | $34,800 | $58,440 |
| 2020 | $13,808 | $102,480 | $34,800 | $67,680 |
| 2019 | $13,408 | $87,780 | $34,800 | $52,980 |
| 2018 | $12,326 | $60,466 | $26,568 | $33,898 |
| 2017 | $11,999 | $58,860 | $34,800 | $24,060 |
| 2016 | $11,519 | $58,860 | $34,800 | $24,060 |
| 2015 | $6,660 | $54,360 | $38,700 | $15,660 |
| 2014 | $6,660 | $53,412 | $38,025 | $15,387 |
Source: Public Records
Map
Nearby Homes
- 68-07 Little Neck Pkwy
- 69-14 Little Neck Pkwy Unit 126B
- 70-50 260th St Unit H-2
- 71-03 252nd St Unit 199B
- 251-26 71st Ave Unit 86A
- 71-21 252nd St Unit 191A
- 72-45 Little Neck Pkwy Unit upper
- 252-15 72nd Ave Unit 166A
- 251-47 71st Rd Unit 57A
- 261-34 Langston Ave Unit E-2
- 251-41 71st Rd Unit 54B
- 63-41 252nd St
- 252-01 72nd Ave
- 252-01 72nd Ave Unit Lower
- 251-35 71st Rd Unit 51B
- 264-11 73rd Ave Unit 128A4
- 71-50 252nd St Unit 11B
- 61-25 255th St Unit 980
- 251-5 71st Rd Unit 5
- 73-18 260th St Unit B-1
- 6911 260th Place
- 26006 69th Ave
- 6917 260th Place
- 26016 69th Ave
- 26016 69th Ave
- 6910 261st St
- 6910 260th Place
- 6925 260th Place
- 6916 260th Place
- 6904 260th Place
- 6916 261st St
- 26001 69th Ave
- 26005 69th Ave
- 6924 260th Place
- 26011 69th Ave
- 6931 260th Place
- 26017 69th Ave
- 71-38 Little Neck Pkwa
- 69-15 Little Neck Pkwy Unit 2
- 69-15 Little Neck Pkwy