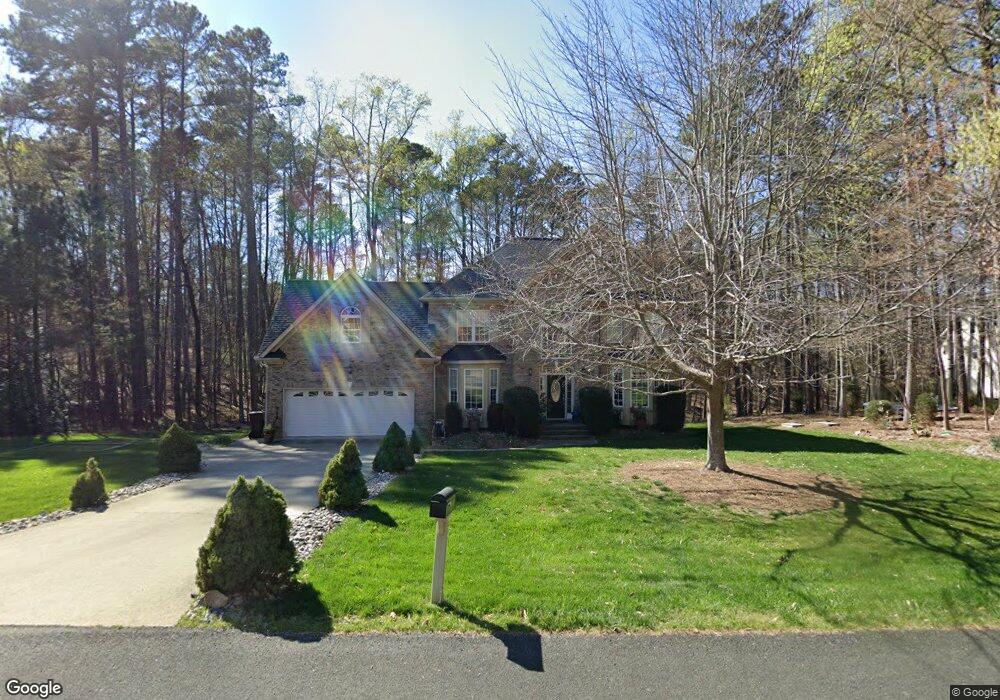
69 Wilder Ridge Chapel Hill, NC 27517
Estimated Value: $674,509 - $755,000
3
Beds
3
Baths
2,716
Sq Ft
$264/Sq Ft
Est. Value
About This Home
This home is located at 69 Wilder Ridge, Chapel Hill, NC 27517 and is currently estimated at $717,127, approximately $264 per square foot. 69 Wilder Ridge is a home located in Chatham County with nearby schools including North Chatham Elementary School, Margaret B. Pollard Middle School, and Woods Charter.
Ownership History
Date
Name
Owned For
Owner Type
Purchase Details
Closed on
Nov 12, 2013
Sold by
Jones Michael and Jones Lucia
Bought by
Cuchiara Michael Paul and Cuchiara Maude Lucille
Current Estimated Value
Home Financials for this Owner
Home Financials are based on the most recent Mortgage that was taken out on this home.
Original Mortgage
$319,000
Outstanding Balance
$237,924
Interest Rate
4.31%
Mortgage Type
New Conventional
Estimated Equity
$479,203
Purchase Details
Closed on
Sep 28, 2012
Sold by
Weiss Mordehay and Grinstein Weiss Michal
Bought by
Jones Lucia and Jones Michael
Home Financials for this Owner
Home Financials are based on the most recent Mortgage that was taken out on this home.
Original Mortgage
$314,450
Interest Rate
3.64%
Mortgage Type
New Conventional
Create a Home Valuation Report for This Property
The Home Valuation Report is an in-depth analysis detailing your home's value as well as a comparison with similar homes in the area
Home Values in the Area
Average Home Value in this Area
Purchase History
| Date | Buyer | Sale Price | Title Company |
|---|---|---|---|
| Cuchiara Michael Paul | $359,000 | None Available | |
| Jones Lucia | $331,000 | None Available |
Source: Public Records
Mortgage History
| Date | Status | Borrower | Loan Amount |
|---|---|---|---|
| Open | Cuchiara Michael Paul | $319,000 | |
| Previous Owner | Jones Lucia | $314,450 |
Source: Public Records
Tax History Compared to Growth
Tax History
| Year | Tax Paid | Tax Assessment Tax Assessment Total Assessment is a certain percentage of the fair market value that is determined by local assessors to be the total taxable value of land and additions on the property. | Land | Improvement |
|---|---|---|---|---|
| 2025 | $4,654 | $640,615 | $85,000 | $555,615 |
| 2024 | $4,654 | $411,970 | $65,000 | $346,970 |
| 2023 | $3,651 | $411,970 | $65,000 | $346,970 |
| 2022 | $3,198 | $392,415 | $65,000 | $327,415 |
| 2021 | $3,158 | $392,415 | $65,000 | $327,415 |
| 2020 | $2,681 | $328,491 | $65,000 | $263,491 |
| 2019 | $2,681 | $328,491 | $65,000 | $263,491 |
| 2018 | $2,493 | $328,491 | $65,000 | $263,491 |
| 2017 | $2,493 | $328,491 | $65,000 | $263,491 |
| 2016 | $2,511 | $328,491 | $65,000 | $263,491 |
| 2015 | $2,472 | $328,491 | $65,000 | $263,491 |
| 2014 | $2,423 | $328,491 | $65,000 | $263,491 |
| 2013 | -- | $328,491 | $65,000 | $263,491 |
Source: Public Records
Map
Nearby Homes
- 485 Legend Oaks Dr
- 158 Poplar St Unit A
- 106 N Duelling Oaks Dr
- 79 Oldham Estate Dr
- Nora II Plan at Chapel Oaks
- Stoneridge Plan at Chapel Oaks
- Hampshire Plan at Chapel Oaks
- Kendrick Plan at Chapel Oaks
- Rosella Plan at Chapel Oaks
- Dunmore Plan at Chapel Oaks
- Halstead Plan at Chapel Oaks
- 1420 Briar Chapel Pkwy
- 610 Bennett Mountain Trace
- 540 Patterson Dr
- 22005 Turner
- 170 Cherokee Dr
- 132 Deardom Way
- 188 Cherokee Dr
- 347 Dark Forest Dr
- 548 Cedar Lake Rd Unit A & B
- 69 Wilder Ridge
- 43 Wilder Ridge
- 54 Wilder Ridge
- 101 Wilder Ridge
- 25 Wilder Ridge
- 118 Wilder Ridge
- 40 Wilder Ridge
- 131 Wilder Ridge
- 261 Sneeden Rd
- 151 Wilder Ridge
- 11 Wilder Ridge
- 93 Old Wilder Ln
- 10 Wilder Ridge
- 150 Wilder Ridge
- 61 Old Wilder Ln
- 33 Old Wilder Ln
- 101 Old Wilder Ln
- 400 Old Wilder Ln
- 400 Old Wilder Ln Unit 17
- 3 Lystra Preserve Dr Unit 3