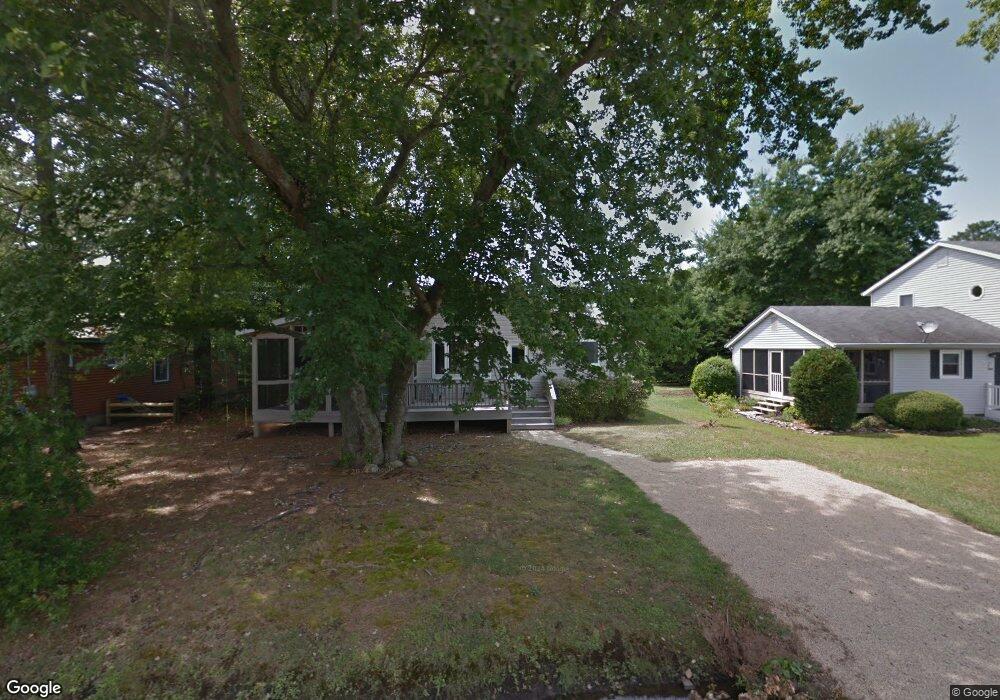
690 Half Moon Dr Bethany Beach, DE 19930
Estimated Value: $765,234 - $828,000
4
Beds
2
Baths
1,312
Sq Ft
$601/Sq Ft
Est. Value
About This Home
This home is located at 690 Half Moon Dr, Bethany Beach, DE 19930 and is currently estimated at $788,059, approximately $600 per square foot. 690 Half Moon Dr is a home located in Sussex County with nearby schools including Lord Baltimore Elementary School, Selbyville Middle School, and Indian River High School.
Ownership History
Date
Name
Owned For
Owner Type
Purchase Details
Closed on
Jan 10, 2014
Sold by
Mary Ann Mary Ann and Cronin William John
Bought by
Cronin Mchale Julie and Mchale Stephen B
Current Estimated Value
Home Financials for this Owner
Home Financials are based on the most recent Mortgage that was taken out on this home.
Original Mortgage
$150,000
Outstanding Balance
$113,502
Interest Rate
4.45%
Mortgage Type
New Conventional
Estimated Equity
$674,557
Create a Home Valuation Report for This Property
The Home Valuation Report is an in-depth analysis detailing your home's value as well as a comparison with similar homes in the area
Home Values in the Area
Average Home Value in this Area
Purchase History
| Date | Buyer | Sale Price | Title Company |
|---|---|---|---|
| Cronin Mchale Julie | -- | -- |
Source: Public Records
Mortgage History
| Date | Status | Borrower | Loan Amount |
|---|---|---|---|
| Open | Cronin Mchale Julie | $150,000 |
Source: Public Records
Tax History Compared to Growth
Tax History
| Year | Tax Paid | Tax Assessment Tax Assessment Total Assessment is a certain percentage of the fair market value that is determined by local assessors to be the total taxable value of land and additions on the property. | Land | Improvement |
|---|---|---|---|---|
| 2025 | $1,284 | $18,600 | $5,500 | $13,100 |
| 2024 | $769 | $18,600 | $5,500 | $13,100 |
| 2023 | $768 | $18,600 | $5,500 | $13,100 |
| 2022 | $756 | $18,600 | $5,500 | $13,100 |
| 2021 | $733 | $18,600 | $5,500 | $13,100 |
| 2020 | $700 | $18,600 | $5,500 | $13,100 |
| 2019 | $697 | $18,600 | $5,500 | $13,100 |
| 2018 | $703 | $18,600 | $0 | $0 |
| 2017 | $709 | $18,600 | $0 | $0 |
| 2016 | $625 | $18,600 | $0 | $0 |
| 2015 | $644 | $18,600 | $0 | $0 |
| 2014 | $634 | $18,600 | $0 | $0 |
Source: Public Records
Map
Nearby Homes
- 708 Fenwood Cir
- 539 Candlelight Ln
- 602 Second St
- 415 Collins St
- 674 Tingle Ave
- 679 Evans Ave
- 761 Salt Pond Rd
- 793 Salt Pond Cir Unit A
- 660 Tingle Ave
- 610 6th St
- 662 Tingle Ave
- 816 Garfield Pkwy
- 433 Gibson Ave
- 982 Turtle Dr
- 306 Hollywood St
- 39885 Garfield Pkwy Unit 165
- 33232 Walston Walk Ct
- PH03 Farragut House Unit PH03
- Lot 9 Ogre Dr
- 32706 E Riga Dr
- 692 Half Moon Dr
- 688 Half Moon Dr
- 693 Fenwood Ct
- 691 Fenwood Ct
- 694 Half Moon Dr
- 686 Half Moon Dr
- 695 Fenwood Ct
- 600 Old Post Ct
- 691 Half Moon Dr
- 689 Fenwood Ct
- 693 Half Moon Dr
- 697 Fenwood Ct
- 696 Half Moon Dr
- 600 Rosewood Ct
- 602 Rosewood Ct
- 601 Old Post Ct
- 692 Fenwood Ct
- 604 Rosewood Ct
- 695 Half Moon Dr
- 688 Fenwood Ct