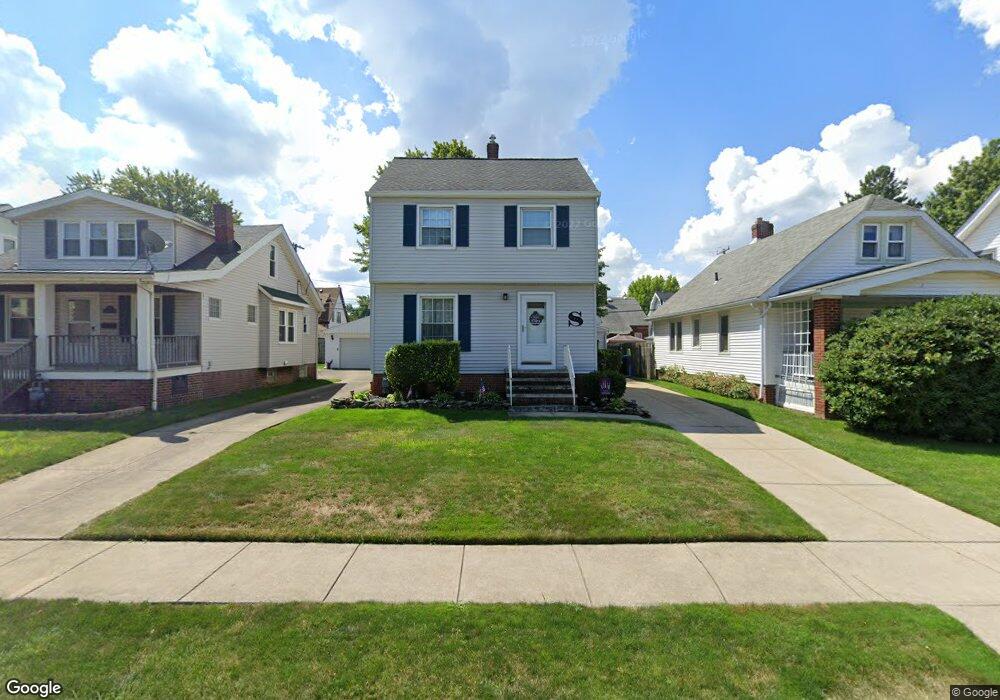
6911 Orchard Ave Cleveland, OH 44129
Estimated Value: $171,897 - $200,000
3
Beds
1
Bath
1,089
Sq Ft
$171/Sq Ft
Est. Value
About This Home
This home is located at 6911 Orchard Ave, Cleveland, OH 44129 and is currently estimated at $185,974, approximately $170 per square foot. 6911 Orchard Ave is a home located in Cuyahoga County with nearby schools including Thoreau Park Elementary School, Shiloh Middle School, and Parma High School.
Ownership History
Date
Name
Owned For
Owner Type
Purchase Details
Closed on
Feb 6, 2020
Sold by
Smith Kristofer N and Papp Sarah A
Bought by
Smith Kristofer N and Smith Sarah A
Current Estimated Value
Home Financials for this Owner
Home Financials are based on the most recent Mortgage that was taken out on this home.
Original Mortgage
$83,500
Outstanding Balance
$57,694
Interest Rate
3.72%
Mortgage Type
New Conventional
Estimated Equity
$128,280
Purchase Details
Closed on
Mar 23, 2005
Sold by
Londrico Louis J and Londrico Michele A
Bought by
Smith Kristofer N and Papp Sarah A
Home Financials for this Owner
Home Financials are based on the most recent Mortgage that was taken out on this home.
Original Mortgage
$118,903
Interest Rate
6.37%
Mortgage Type
Purchase Money Mortgage
Purchase Details
Closed on
Jan 16, 2004
Sold by
Gorges Mary
Bought by
Londrico Louis J
Purchase Details
Closed on
Jan 1, 1975
Bought by
Gorges Mary
Create a Home Valuation Report for This Property
The Home Valuation Report is an in-depth analysis detailing your home's value as well as a comparison with similar homes in the area
Home Values in the Area
Average Home Value in this Area
Purchase History
| Date | Buyer | Sale Price | Title Company |
|---|---|---|---|
| Smith Kristofer N | -- | Hbi Title Services | |
| Smith Kristofer N | $118,903 | Guardian Title & Guaranty | |
| Londrico Louis J | $80,000 | Guardian Title & Guaranty | |
| Gorges Mary | -- | -- |
Source: Public Records
Mortgage History
| Date | Status | Borrower | Loan Amount |
|---|---|---|---|
| Open | Smith Kristofer N | $83,500 | |
| Closed | Smith Kristofer N | $118,903 |
Source: Public Records
Tax History Compared to Growth
Tax History
| Year | Tax Paid | Tax Assessment Tax Assessment Total Assessment is a certain percentage of the fair market value that is determined by local assessors to be the total taxable value of land and additions on the property. | Land | Improvement |
|---|---|---|---|---|
| 2024 | $3,161 | $51,345 | $9,940 | $41,405 |
| 2023 | $2,895 | $40,500 | $8,190 | $32,310 |
| 2022 | $2,867 | $40,500 | $8,190 | $32,310 |
| 2021 | $2,949 | $40,500 | $8,190 | $32,310 |
| 2020 | $2,584 | $31,150 | $6,300 | $24,850 |
| 2019 | $2,471 | $89,000 | $18,000 | $71,000 |
| 2018 | $2,363 | $31,150 | $6,300 | $24,850 |
| 2017 | $2,402 | $28,070 | $5,250 | $22,820 |
| 2016 | $2,387 | $28,070 | $5,250 | $22,820 |
| 2015 | $2,276 | $28,070 | $5,250 | $22,820 |
| 2014 | $2,276 | $28,640 | $5,360 | $23,280 |
Source: Public Records
Map
Nearby Homes
- 6903 Forest Ave
- 6711 Forest Ave
- 6306 Gilbert Ave
- 6215 Forest Ave
- 7609 Wooster Pkwy
- 7600 Dresden Ave
- 5914 Forest Ave
- 6706 Alber Ave
- 6903 Alber Ave
- 5815 Westlake Ave
- 6606 Theota Ave
- 7910 Dresden Ave
- 7619 Snow Rd
- 6021 Snow Rd
- 6011 Theota Ave
- 8018 Pinegrove Ave
- 6704 Charles Ave
- 8119 Pinegrove Ave
- 7615 Bertha Ave
- 6818 Hampstead Ave
- 6907 Orchard Ave
- 6915 Orchard Ave
- 7003 Orchard Ave
- 6819 Orchard Ave
- 6910 Forest Ave
- 7007 Orchard Ave
- 6906 Forest Ave
- 6914 Forest Ave
- 6902 Forest Ave
- 7002 Forest Ave
- 6815 Orchard Ave
- 7011 Orchard Ave
- 6818 Forest Ave
- 6910 Orchard Ave
- 7006 Forest Ave
- 6906 Orchard Ave
- 6914 Orchard Ave
- 6902 Orchard Ave
- 6814 Forest Ave
- 6811 Orchard Ave