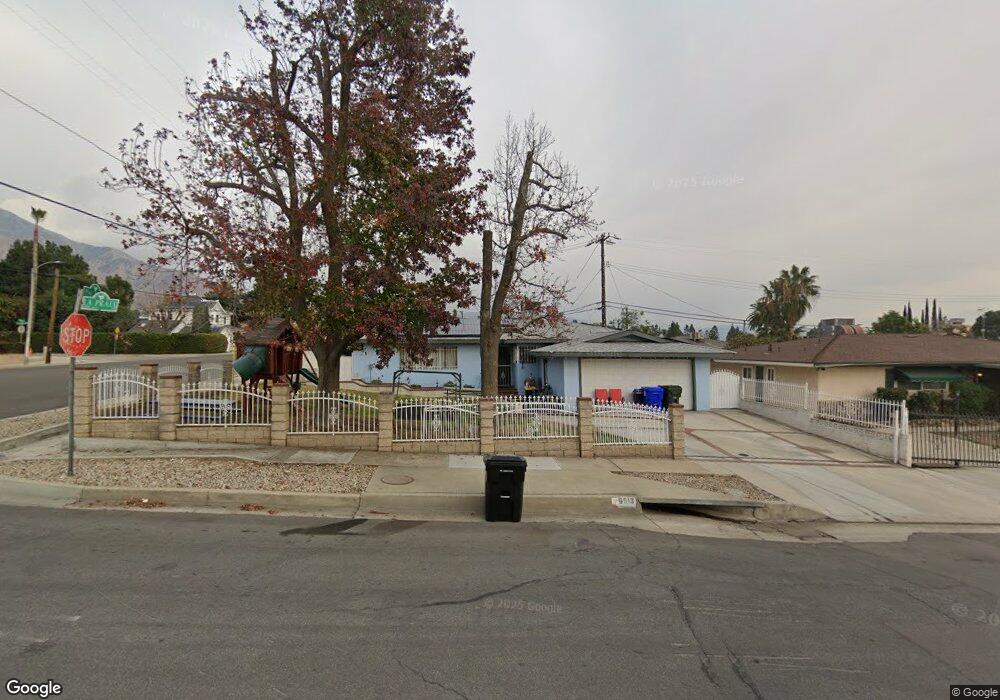
6913 La Praix St Highland, CA 92346
Crossroads NeighborhoodEstimated Value: $539,096 - $573,000
3
Beds
2
Baths
1,522
Sq Ft
$363/Sq Ft
Est. Value
About This Home
This home is located at 6913 La Praix St, Highland, CA 92346 and is currently estimated at $551,774, approximately $362 per square foot. 6913 La Praix St is a home located in San Bernardino County with nearby schools including Thompson Elementary School, Serrano Middle School, and San Gorgonio High School.
Ownership History
Date
Name
Owned For
Owner Type
Purchase Details
Closed on
Oct 24, 2002
Sold by
Mackamul Nicolas P
Bought by
Mackamul Nicolas P and Mackamul Flora
Current Estimated Value
Home Financials for this Owner
Home Financials are based on the most recent Mortgage that was taken out on this home.
Original Mortgage
$29,000
Interest Rate
5.99%
Mortgage Type
Credit Line Revolving
Purchase Details
Closed on
Dec 28, 2001
Sold by
Mackamul Nicolas P
Bought by
Mackamul Nicolas P and Mackamul Flora R
Purchase Details
Closed on
Oct 16, 1997
Sold by
Chapman Doris J Chapman Walter E
Bought by
Mackamul Nicolas P
Home Financials for this Owner
Home Financials are based on the most recent Mortgage that was taken out on this home.
Original Mortgage
$74,400
Interest Rate
7.26%
Mortgage Type
Balloon
Create a Home Valuation Report for This Property
The Home Valuation Report is an in-depth analysis detailing your home's value as well as a comparison with similar homes in the area
Home Values in the Area
Average Home Value in this Area
Purchase History
| Date | Buyer | Sale Price | Title Company |
|---|---|---|---|
| Mackamul Nicolas P | -- | Fidelity National Title | |
| Mackamul Nicolas P | -- | -- | |
| Mackamul Nicolas P | $93,000 | Chicago Title Co |
Source: Public Records
Mortgage History
| Date | Status | Borrower | Loan Amount |
|---|---|---|---|
| Closed | Mackamul Nicolas P | $29,000 | |
| Closed | Mackamul Nicolas P | $74,400 | |
| Closed | Mackamul Nicolas P | $13,950 |
Source: Public Records
Tax History Compared to Growth
Tax History
| Year | Tax Paid | Tax Assessment Tax Assessment Total Assessment is a certain percentage of the fair market value that is determined by local assessors to be the total taxable value of land and additions on the property. | Land | Improvement |
|---|---|---|---|---|
| 2025 | $2,175 | $148,498 | $44,708 | $103,790 |
| 2024 | $2,175 | $145,586 | $43,831 | $101,755 |
| 2023 | $4,987 | $142,732 | $42,972 | $99,760 |
| 2022 | $4,983 | $139,933 | $42,129 | $97,804 |
| 2021 | $4,943 | $137,189 | $41,303 | $95,886 |
| 2020 | $4,932 | $135,782 | $40,879 | $94,903 |
| 2019 | $4,847 | $133,119 | $40,077 | $93,042 |
| 2018 | $4,758 | $130,509 | $39,291 | $91,218 |
| 2017 | $1,610 | $127,950 | $38,521 | $89,429 |
| 2016 | $1,561 | $125,441 | $37,766 | $87,675 |
| 2015 | $1,588 | $123,557 | $37,199 | $86,358 |
| 2014 | $1,544 | $121,136 | $36,470 | $84,666 |
Source: Public Records
Map
Nearby Homes
- 6941 La Praix St
- 7001 Church Ave Unit 5
- 6986 Church Ave
- 27471 Main St
- 27600 Atlantic Ave Unit 427
- 27856 Fieldstone Dr
- 27875 Rainbow Ln
- 27953 Atlantic Ave
- 27451 Villa Ave
- 28037 Clifton St
- 27888 Rainbow Ln
- 3850 Atlantic Ave Unit 58
- 3850 Atlantic Ave Unit 217
- 3850 Atlantic Ave Unit 275
- 3850 Atlantic Ave Unit 296
- 3850 Atlantic Ave Unit 257
- 3850 Atlantic Ave Unit 27
- 3850 Atlantic Ave Unit 274
- 3850 Atlantic Ave Unit 60
- 3850 Atlantic Ave Unit 151
- 6921 La Praix St
- 6914 Seine Ave
- 6924 Seine Ave
- 6931 La Praix St
- 1604 La Praix St
- 1594 La Praix St
- 6934 Seine Ave
- 1588 La Praix St
- 1559 Buckeye St
- 1616 La Praix St
- 1605 Denair Ave
- 6944 Seine Ave
- 4044 Pacific St
- 6951 La Praix St
- 1565 Buckeye St
- 6913 Seine Ave
- 1630 La Praix St
- 1575 Buckeye St
- 6925 Seine Ave
- 1623 Denair Ave