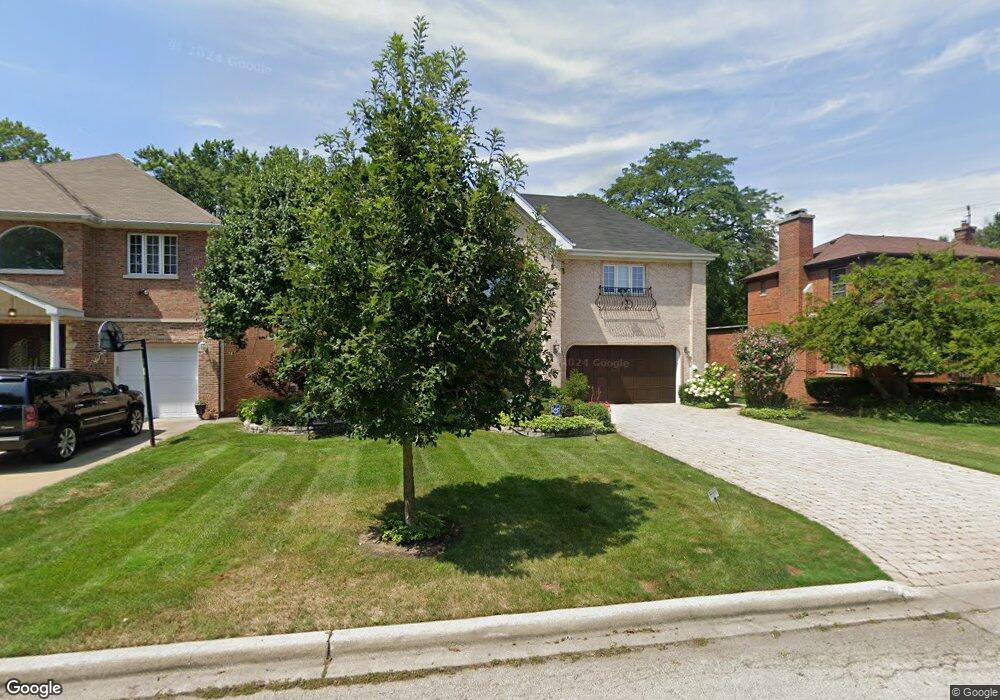
6926 N Kilpatrick Ave Lincolnwood, IL 60712
Estimated Value: $923,000 - $1,747,000
6
Beds
4
Baths
5,148
Sq Ft
$284/Sq Ft
Est. Value
About This Home
This home is located at 6926 N Kilpatrick Ave, Lincolnwood, IL 60712 and is currently estimated at $1,462,774, approximately $284 per square foot. 6926 N Kilpatrick Ave is a home located in Cook County with nearby schools including Todd Hall Elementary School, Rutledge Hall Elementary School, and Lincoln Hall Middle School.
Ownership History
Date
Name
Owned For
Owner Type
Purchase Details
Closed on
Dec 7, 2004
Sold by
Keaton Sunny
Bought by
Cohen Bernard and Cohen Lois
Current Estimated Value
Purchase Details
Closed on
Feb 5, 2003
Sold by
Keaton Roger M and Keaton Sunny
Bought by
Keaton Sunny and Sunny Keaton Revocable Trust
Home Financials for this Owner
Home Financials are based on the most recent Mortgage that was taken out on this home.
Original Mortgage
$585,000
Interest Rate
5.25%
Purchase Details
Closed on
May 30, 1995
Sold by
Hodza Vebi and Hodza Rosemary B
Bought by
Keaton Roger M and Keaton Sunny
Home Financials for this Owner
Home Financials are based on the most recent Mortgage that was taken out on this home.
Original Mortgage
$550,000
Interest Rate
7.05%
Create a Home Valuation Report for This Property
The Home Valuation Report is an in-depth analysis detailing your home's value as well as a comparison with similar homes in the area
Home Values in the Area
Average Home Value in this Area
Purchase History
| Date | Buyer | Sale Price | Title Company |
|---|---|---|---|
| Cohen Bernard | $1,142,000 | Cti | |
| Keaton Sunny | -- | -- | |
| Keaton Roger M | $698,000 | -- |
Source: Public Records
Mortgage History
| Date | Status | Borrower | Loan Amount |
|---|---|---|---|
| Previous Owner | Keaton Sunny | $585,000 | |
| Previous Owner | Keaton Roger M | $550,000 | |
| Closed | Keaton Sunny | $295,000 |
Source: Public Records
Tax History Compared to Growth
Tax History
| Year | Tax Paid | Tax Assessment Tax Assessment Total Assessment is a certain percentage of the fair market value that is determined by local assessors to be the total taxable value of land and additions on the property. | Land | Improvement |
|---|---|---|---|---|
| 2024 | $29,237 | $109,340 | $11,760 | $97,580 |
| 2023 | $28,084 | $109,340 | $11,760 | $97,580 |
| 2022 | $28,084 | $109,340 | $11,760 | $97,580 |
| 2021 | $21,698 | $74,791 | $8,400 | $66,391 |
| 2020 | $21,300 | $74,791 | $8,400 | $66,391 |
| 2019 | $21,499 | $83,102 | $8,400 | $74,702 |
| 2018 | $23,876 | $87,990 | $7,350 | $80,640 |
| 2017 | $23,975 | $87,990 | $7,350 | $80,640 |
| 2016 | $22,793 | $87,990 | $7,350 | $80,640 |
| 2015 | $20,803 | $74,338 | $6,300 | $68,038 |
| 2014 | $19,961 | $74,338 | $6,300 | $68,038 |
| 2013 | $19,514 | $74,338 | $6,300 | $68,038 |
Source: Public Records
Map
Nearby Homes
- 6857 N Knox Ave
- 6826 N Knox Ave
- 4900 Morse Ave
- 6725 N Cicero Ave
- 4465 W Lunt Ave
- 4601 W Touhy Ave Unit 714
- 4545 W Touhy Ave Unit 511
- 4545 W Touhy Ave Unit 420
- 6644 N Kenton Ave
- 6739 N Leroy Ave
- 7241 N Kilpatrick Ave
- 6750 N Kostner Ave
- 8146 N Kilpatrick Ave Unit 1S
- 7201 N Lincoln Ave Unit 308
- 7201 N Lincoln Ave Unit 301
- 4858 W Chase Ave
- 6505 N Knox Ave
- 5148 Coyle Ave
- 7330 N Kilbourn Ave
- 7245 N Kostner Ave
- 6922 N Kilpatrick Ave
- 6930 N Kilpatrick Ave
- 6938 N Kilpatrick Ave
- 6916 N Kilpatrick Ave
- 6939 N Keating Ave
- 6941 N Keating Ave
- 6933 N Keating Ave
- 6942 N Kilpatrick Ave
- 6947 N Keating Ave
- 6931 N Keating Ave
- 6925 N Kilpatrick Ave
- 6923 N Kilpatrick Ave
- 6931 N Kilpatrick Ave
- 6915 N Kilpatrick Ave
- 6929 N Keating Ave
- 6900 N Kilpatrick Ave
- 6900 N Kilpatrick Ave
- 6951 N Keating Ave
- 6939 N Kilpatrick Ave
- 6950 N Kilpatrick Ave