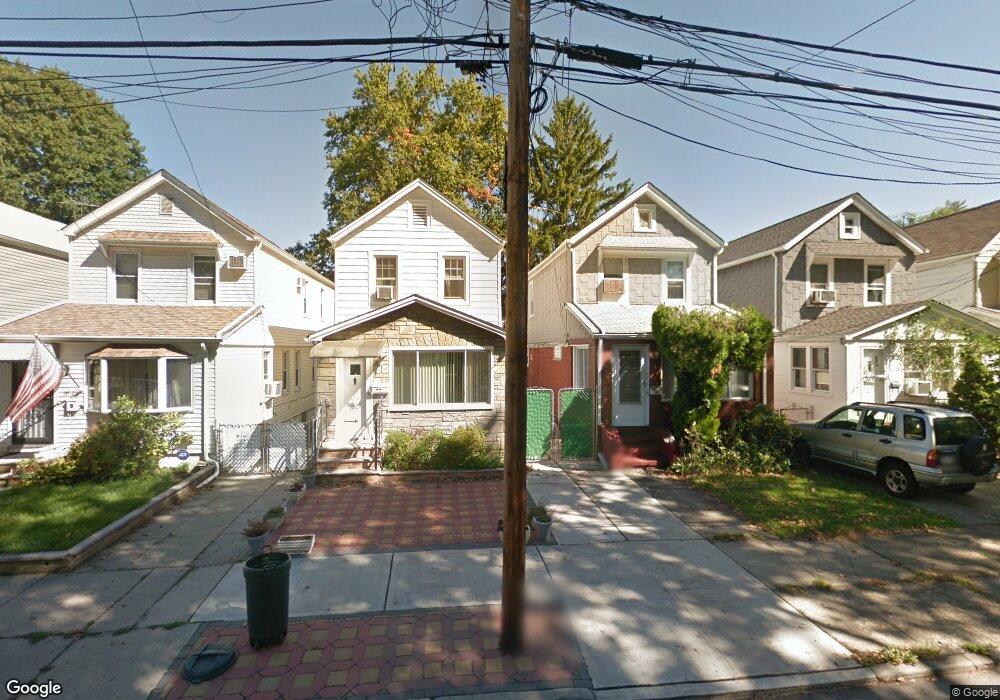
6927 Nansen St Forest Hills, NY 11375
Forest Hills NeighborhoodEstimated Value: $1,030,976 - $1,195,000
--
Bed
--
Bath
1,315
Sq Ft
$850/Sq Ft
Est. Value
About This Home
This home is located at 6927 Nansen St, Forest Hills, NY 11375 and is currently estimated at $1,117,744, approximately $849 per square foot. 6927 Nansen St is a home located in Queens County with nearby schools including Ps 144 Col Jeromus Remsen, J.H.S. 190 Russell Sage, and Queens Metropolitan High School.
Ownership History
Date
Name
Owned For
Owner Type
Purchase Details
Closed on
Jan 16, 2020
Sold by
Murdakhayev Robert and Raziyeva Marina
Bought by
Nigro Nicholas J and Xu Siqian
Current Estimated Value
Home Financials for this Owner
Home Financials are based on the most recent Mortgage that was taken out on this home.
Original Mortgage
$824,000
Outstanding Balance
$726,346
Interest Rate
3.7%
Mortgage Type
Purchase Money Mortgage
Estimated Equity
$391,398
Purchase Details
Closed on
Oct 2, 2000
Sold by
Brautigam Paul Walter and Stoltz Loretta
Bought by
Murdakhayev Robert and Raziyeva Marina
Home Financials for this Owner
Home Financials are based on the most recent Mortgage that was taken out on this home.
Original Mortgage
$252,450
Interest Rate
7.83%
Purchase Details
Closed on
May 31, 2000
Sold by
Brautigam Martha and Brautigam Paul Walter
Bought by
Brautigam Paul Walter and Stoltz Loretta
Create a Home Valuation Report for This Property
The Home Valuation Report is an in-depth analysis detailing your home's value as well as a comparison with similar homes in the area
Home Values in the Area
Average Home Value in this Area
Purchase History
| Date | Buyer | Sale Price | Title Company |
|---|---|---|---|
| Nigro Nicholas J | $1,030,000 | -- | |
| Nigro Nicholas J | $1,030,000 | -- | |
| Murdakhayev Robert | -- | -- | |
| Nigro Nicholas J | $1,030,000 | -- | |
| Murdakhayev Robert | -- | -- | |
| Murdakhayev Robert | $297,000 | -- | |
| Murdakhayev Robert | $297,000 | -- | |
| Brautigam Paul Walter | -- | -- | |
| Brautigam Paul Walter | -- | -- |
Source: Public Records
Mortgage History
| Date | Status | Borrower | Loan Amount |
|---|---|---|---|
| Open | Nigro Nicholas J | $824,000 | |
| Closed | Nigro Nicholas J | $824,000 | |
| Previous Owner | Murdakhayev Robert | $252,450 |
Source: Public Records
Tax History Compared to Growth
Tax History
| Year | Tax Paid | Tax Assessment Tax Assessment Total Assessment is a certain percentage of the fair market value that is determined by local assessors to be the total taxable value of land and additions on the property. | Land | Improvement |
|---|---|---|---|---|
| 2025 | $7,944 | $40,738 | $8,732 | $32,006 |
| 2024 | $7,944 | $39,554 | $8,939 | $30,615 |
| 2023 | $7,513 | $37,404 | $8,003 | $29,401 |
| 2022 | $7,124 | $55,800 | $13,980 | $41,820 |
| 2021 | $7,148 | $59,700 | $13,980 | $45,720 |
| 2020 | $7,186 | $56,100 | $13,980 | $42,120 |
| 2019 | $6,895 | $56,100 | $13,980 | $42,120 |
| 2018 | $6,354 | $31,170 | $7,734 | $23,436 |
| 2017 | $6,062 | $29,738 | $9,141 | $20,597 |
| 2016 | $5,658 | $29,738 | $9,141 | $20,597 |
| 2015 | $3,164 | $28,290 | $10,969 | $17,321 |
| 2014 | $3,164 | $27,469 | $11,721 | $15,748 |
Source: Public Records
Map
Nearby Homes
- 6915 Loubet St
- 70-15 Nansen St
- 70-19 Manse St
- 68-15 Selfridge Stre 68-15 Selfridge St Unit 5G
- 6828 Kessel St
- 68-15 Selfridge St Unit 6A
- 68-15 Selfridge St Unit 3J
- 68-15 Selfridge St Unit 1J
- 68-15 Selfridge St Unit 5D
- 68-37 Kessel St
- 70-43 Nansen St
- 68-48 Juno St Unit Whole Building
- 100-33 Metropolitan Ave
- 68-20 Selfridge St Unit 6J
- 68-20 Selfridge St Unit 4K
- 68-20 Selfridge St Unit 6H
- 90-01 68th Ave
- 6897 Alderton St
- 70-47 Juno St
- 69-01 Alderton St
- 6931 Nansen St
- 6933 Nansen St
- 6935 Nansen St
- 6925 Nansen St
- 69-35 Nansen St Unit 2nd FL
- 6937 Nansen St
- 6937 Nansen St
- 6923 Nansen St
- 6939 Nansen St
- 6921 Nansen St
- 6930 Manse St
- 6921 Nansen St
- 69-39 Nansen St Unit 2
- 6932 Manse St
- 6928 Manse St
- 6936 Manse St
- 6924 Manse St
- 69-22 Manse St
- 6941 Nansen St
- 6919 Nansen St