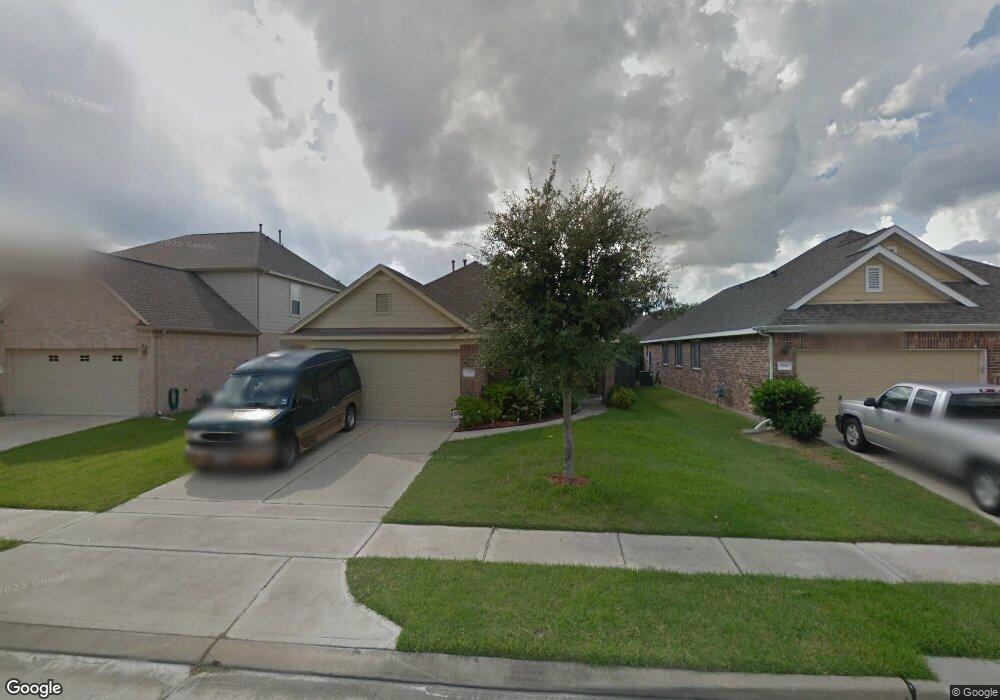
6939 Kamiah Ct Houston, TX 77040
Brookhollow West NeighborhoodEstimated Value: $268,843 - $296,000
3
Beds
2
Baths
1,788
Sq Ft
$159/Sq Ft
Est. Value
About This Home
This home is located at 6939 Kamiah Ct, Houston, TX 77040 and is currently estimated at $284,211, approximately $158 per square foot. 6939 Kamiah Ct is a home located in Harris County with nearby schools including Post Elementary School, Dean Middle School, and Jersey Village High School.
Ownership History
Date
Name
Owned For
Owner Type
Purchase Details
Closed on
Mar 14, 2013
Sold by
Secretary Of Hud
Bought by
Palomino Wilmer
Current Estimated Value
Home Financials for this Owner
Home Financials are based on the most recent Mortgage that was taken out on this home.
Original Mortgage
$113,898
Outstanding Balance
$81,135
Interest Rate
3.75%
Mortgage Type
FHA
Estimated Equity
$203,076
Purchase Details
Closed on
Dec 6, 2012
Sold by
Wells Fargo Bank Na
Bought by
The Secretary Of Hud
Purchase Details
Closed on
Dec 4, 2012
Sold by
Core Candy J
Bought by
Wells Fargo Bank Na
Purchase Details
Closed on
Apr 28, 2010
Sold by
Long Lake Ltd
Bought by
Core Candy J
Home Financials for this Owner
Home Financials are based on the most recent Mortgage that was taken out on this home.
Original Mortgage
$113,731
Interest Rate
5.5%
Mortgage Type
FHA
Create a Home Valuation Report for This Property
The Home Valuation Report is an in-depth analysis detailing your home's value as well as a comparison with similar homes in the area
Home Values in the Area
Average Home Value in this Area
Purchase History
| Date | Buyer | Sale Price | Title Company |
|---|---|---|---|
| Palomino Wilmer | -- | None Available | |
| The Secretary Of Hud | -- | None Available | |
| Wells Fargo Bank Na | $128,982 | None Available | |
| Core Candy J | -- | American Title Company |
Source: Public Records
Mortgage History
| Date | Status | Borrower | Loan Amount |
|---|---|---|---|
| Open | Palomino Wilmer | $113,898 | |
| Previous Owner | Core Candy J | $113,731 |
Source: Public Records
Tax History Compared to Growth
Tax History
| Year | Tax Paid | Tax Assessment Tax Assessment Total Assessment is a certain percentage of the fair market value that is determined by local assessors to be the total taxable value of land and additions on the property. | Land | Improvement |
|---|---|---|---|---|
| 2025 | $4,639 | $275,036 | $56,675 | $218,361 |
| 2024 | $4,639 | $275,036 | $56,675 | $218,361 |
| 2023 | $4,639 | $256,005 | $56,675 | $199,330 |
| 2022 | $6,041 | $240,075 | $40,482 | $199,593 |
| 2021 | $5,782 | $205,750 | $40,482 | $165,268 |
| 2020 | $5,410 | $184,363 | $28,844 | $155,519 |
| 2019 | $5,597 | $184,363 | $28,844 | $155,519 |
| 2018 | $1,662 | $176,980 | $28,844 | $148,136 |
| 2017 | $5,083 | $176,980 | $28,844 | $148,136 |
| 2016 | $4,621 | $168,669 | $28,844 | $139,825 |
| 2015 | $3,382 | $162,654 | $28,844 | $133,810 |
| 2014 | $3,382 | $119,863 | $22,265 | $97,598 |
Source: Public Records
Map
Nearby Homes
- 8817 Emmott Rd
- 7605 Fairbanks North Houston Rd
- 8402 Bondale St
- 9427 Fern Wood Forest
- 7714 Rolling Fork Ln
- 7311 Woodoak Dr
- 7410 Wood Bluff Blvd
- 14142 Packard St
- 9118 Woodwind Lakes Dr
- 7802 Percussion Place
- 6819 Oakwood Grove
- 8715 Andante Dr
- 8020 Oakwood Forest Dr
- 7818 Stoneyway Dr
- 14023 Packard St
- 10119 Grover Ln
- 7824 Stoneyway Dr
- 7903 Bachwood Dr
- 8007 E Oakwood Ct
- 7926 Stoneyway Dr
- 6935 Kamiah Ct
- 6943 Kamiah Ct
- 6938 Poncha Springs Ct
- 6934 Poncha Springs Ct
- 6942 Poncha Springs Ct
- 6930 Poncha Springs Ct
- 6927 Kamiah Ct
- 6938 Kamiah Ct
- 6934 Kamiah Ct
- 6942 Kamiah Ct
- 8918 Parlin Ridge Dr
- 6926 Poncha Springs Ct
- 6930 Kamiah Ct
- 8914 Parlin Ridge Dr
- 8922 Parlin Ridge Dr
- 8910 Parlin Ridge Dr
- 8906 Parlin Ridge Dr
- 6923 Kamiah Ct
- 6926 Kamiah Ct
- 8926 Parlin Ridge Dr