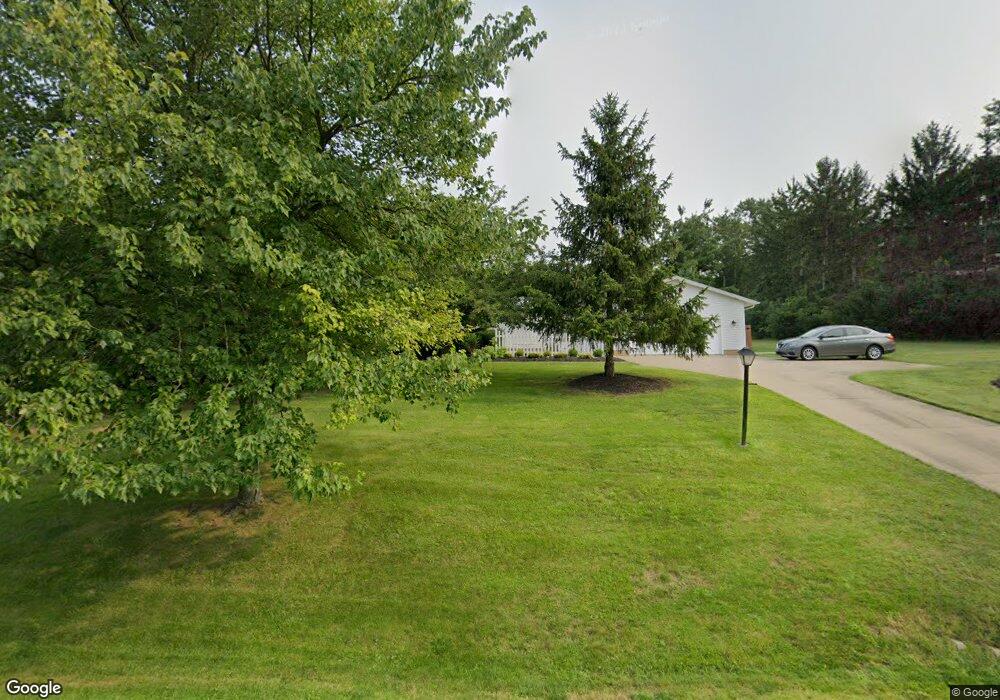
6960 Edgerton Rd North Royalton, OH 44133
Estimated Value: $270,756 - $348,000
3
Beds
1
Bath
1,362
Sq Ft
$231/Sq Ft
Est. Value
About This Home
This home is located at 6960 Edgerton Rd, North Royalton, OH 44133 and is currently estimated at $314,689, approximately $231 per square foot. 6960 Edgerton Rd is a home located in Cuyahoga County with nearby schools including North Royalton Middle School, North Royalton High School, and Saint Albert the Great Roman Catholic School.
Ownership History
Date
Name
Owned For
Owner Type
Purchase Details
Closed on
Sep 26, 2018
Sold by
Fink Steven J and Kolar Kathleen A
Bought by
Ursini Paul J and Ellsworth Tracey M
Current Estimated Value
Home Financials for this Owner
Home Financials are based on the most recent Mortgage that was taken out on this home.
Original Mortgage
$198,000
Outstanding Balance
$172,668
Interest Rate
4.5%
Mortgage Type
New Conventional
Estimated Equity
$142,021
Purchase Details
Closed on
Feb 22, 2008
Sold by
Fink Ernest A
Bought by
Fink Mary A
Purchase Details
Closed on
Jul 9, 1985
Bought by
Fink Ernest and Fink Mary A
Purchase Details
Closed on
Jul 27, 1984
Sold by
Morisky Michael A
Bought by
Hilltop Homes Inc
Purchase Details
Closed on
Jan 1, 1983
Bought by
Morisky Michael A
Create a Home Valuation Report for This Property
The Home Valuation Report is an in-depth analysis detailing your home's value as well as a comparison with similar homes in the area
Home Values in the Area
Average Home Value in this Area
Purchase History
| Date | Buyer | Sale Price | Title Company |
|---|---|---|---|
| Ursini Paul J | $208,000 | Gateway Title Agency | |
| Fink Mary A | -- | Attorney | |
| Fink Ernest | $72,900 | -- | |
| Hilltop Homes Inc | $14,900 | -- | |
| Morisky Michael A | -- | -- |
Source: Public Records
Mortgage History
| Date | Status | Borrower | Loan Amount |
|---|---|---|---|
| Open | Ursini Paul J | $198,000 |
Source: Public Records
Tax History Compared to Growth
Tax History
| Year | Tax Paid | Tax Assessment Tax Assessment Total Assessment is a certain percentage of the fair market value that is determined by local assessors to be the total taxable value of land and additions on the property. | Land | Improvement |
|---|---|---|---|---|
| 2024 | $4,723 | $81,305 | $6,860 | $74,445 |
| 2023 | $4,653 | $73,470 | $7,110 | $66,360 |
| 2022 | $4,622 | $73,470 | $7,110 | $66,360 |
| 2021 | $4,670 | $73,470 | $7,110 | $66,360 |
| 2020 | $4,130 | $61,740 | $5,990 | $55,760 |
| 2019 | $4,009 | $176,400 | $17,100 | $159,300 |
| 2018 | $3,156 | $61,740 | $5,990 | $55,760 |
| 2017 | $3,025 | $52,780 | $9,450 | $43,330 |
| 2016 | $2,835 | $52,780 | $9,450 | $43,330 |
| 2015 | $2,546 | $52,780 | $9,450 | $43,330 |
| 2014 | $2,546 | $47,990 | $8,580 | $39,410 |
Source: Public Records
Map
Nearby Homes
- 16577 State Rd
- 7400 Akins Rd
- 6360 Cady Rd
- 5469 Riverview Dr
- 0 Valley Pkwy Unit 5118483
- 9447 Lindberg Dr
- 19345 Ridge Rd
- BUCHANAN Plan at Pine Hill
- HALEY Plan at Pine Hill
- CHAMP Plan at Pine Hill
- VANDERBURGH Plan at Pine Hill
- BELLEVILLE Plan at Pine Hill
- SEBASTIAN Plan at Pine Hill
- NORTHWOOD Plan at Pine Hill
- LYNDHURST Plan at Pine Hill
- BEDFORD Plan at Pine Hill
- CRESTWOOD Plan at Pine Hill
- BRENNAN Plan at Pine Hill
- VIOLA Plan at Pine Hill
- 5284 Wiltshire Rd
- 6812 Edgerton Rd
- 6976 Edgerton Rd
- 6964 Edgerton Rd
- 7440 Edgerton Rd
- 6943 Edgerton Rd
- 6800 Edgerton Rd
- 6718 Edgerton Rd
- 6867 Edgerton Rd
- 7264 Edgerton Rd
- 6985 Edgerton Rd
- 6961 Edgerton Rd
- 6706 Edgerton Rd
- 6855 Edgerton Rd
- 6997 Edgerton Rd
- 7276 Edgerton Rd
- 6705 Edgerton Rd
- 7540 Edgerton Rd
- 7288 Edgerton Rd
- 6621 Edgerton Rd
- 7021 Edgerton Rd