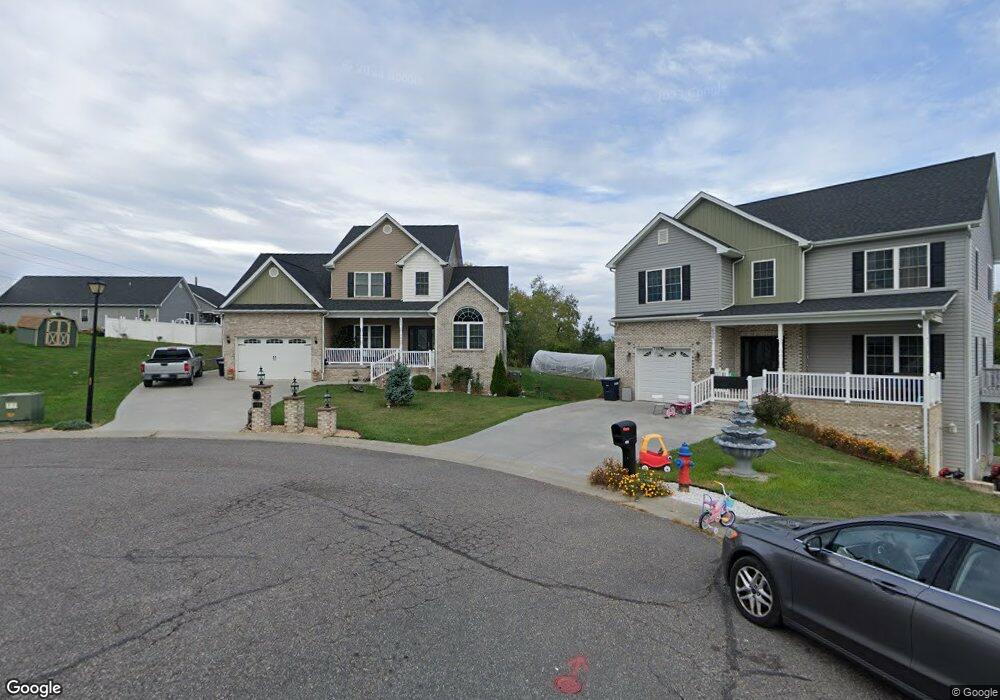
698 Starlight Ct Harrisonburg, VA 22801
Estimated Value: $578,861 - $646,000
5
Beds
5
Baths
3,240
Sq Ft
$189/Sq Ft
Est. Value
About This Home
This home is located at 698 Starlight Ct, Harrisonburg, VA 22801 and is currently estimated at $613,965, approximately $189 per square foot. 698 Starlight Ct is a home located in Rockingham County with nearby schools including Bluestone Elementary, Thomas Harrison Middle School, and Harrisonburg High School.
Ownership History
Date
Name
Owned For
Owner Type
Purchase Details
Closed on
Nov 23, 2020
Sold by
Savuliak Leonid and Savuliak Olga
Bought by
Savuliak Leonid and Savuliak Olga
Current Estimated Value
Purchase Details
Closed on
Oct 27, 2017
Sold by
Holguin Stphany and Holguin Raymon H
Bought by
Savuliak Leonid and Savuliak Olga
Home Financials for this Owner
Home Financials are based on the most recent Mortgage that was taken out on this home.
Original Mortgage
$327,000
Interest Rate
3.9%
Mortgage Type
New Conventional
Purchase Details
Closed on
Dec 2, 2016
Sold by
Holguin Stephany E
Bought by
Holguin Stephany E and Holguin Raymon H
Home Financials for this Owner
Home Financials are based on the most recent Mortgage that was taken out on this home.
Original Mortgage
$235,000
Interest Rate
3.52%
Mortgage Type
Credit Line Revolving
Purchase Details
Closed on
Feb 18, 2016
Sold by
Diversified Properties Llc
Bought by
Holguin Stephany
Create a Home Valuation Report for This Property
The Home Valuation Report is an in-depth analysis detailing your home's value as well as a comparison with similar homes in the area
Home Values in the Area
Average Home Value in this Area
Purchase History
| Date | Buyer | Sale Price | Title Company |
|---|---|---|---|
| Savuliak Leonid | -- | None Available | |
| Savuliak Leonid | $340,000 | None Available | |
| Holguin Stephany E | -- | Investors Title Insurance Co | |
| Holguin Stephany | $46,000 | Stewart Title |
Source: Public Records
Mortgage History
| Date | Status | Borrower | Loan Amount |
|---|---|---|---|
| Previous Owner | Savuliak Leonid | $327,000 | |
| Previous Owner | Holguin Stephany E | $235,000 |
Source: Public Records
Tax History Compared to Growth
Tax History
| Year | Tax Paid | Tax Assessment Tax Assessment Total Assessment is a certain percentage of the fair market value that is determined by local assessors to be the total taxable value of land and additions on the property. | Land | Improvement |
|---|---|---|---|---|
| 2025 | $4,811 | $488,100 | $55,000 | $433,100 |
| 2024 | $4,811 | $476,300 | $55,000 | $421,300 |
| 2023 | $4,138 | $431,000 | $55,000 | $376,000 |
| 2022 | $3,792 | $407,700 | $55,000 | $352,700 |
| 2021 | $3,200 | $355,500 | $48,000 | $307,500 |
| 2020 | $3,019 | $346,200 | $43,000 | $303,200 |
| 2019 | $2,948 | $337,900 | $43,000 | $294,900 |
| 2018 | $310 | $330,700 | $43,000 | $287,700 |
| 2017 | $310 | $43,000 | $43,000 | $0 |
| 2016 | $310 | $43,000 | $43,000 | $0 |
| 2015 | $310 | $43,000 | $43,000 | $0 |
| 2014 | -- | $45,000 | $45,000 | $0 |
Source: Public Records
Map
Nearby Homes
- 2020 Shoeshine Ave
- 550 Grommet Dr
- 745 Wingtip Way
- 2102 Willow Hill Dr
- 2112 Willow Hill Dr
- 2105 Willow Hill Dr
- 2122 Willow Hill Dr
- 1739 Kingston Ct
- 2132 Willow Hill Dr
- 210 W Mosby Rd
- 2414 Millwood Loop Unit 15
- 521 Hickory Grove Cir
- 52 South Ave Unit G
- 655 Greenwood St
- 3346 White Oak Dr
- 44 South Ave Unit G
- 3345 Redbud Ln
- 1435 Bluestone St
- 1450 Bluestone St
- 100 Monument Ave
- 699 Starlight Ct
- 684 Starlight Ct
- 691 Suncrest Ct
- 691 Starlight Ct
- 681 Suncrest Ct
- 1966 Russell Dr
- 0 Starlight Ct Unit 183538
- 0 Starlight Ct Unit 532229
- 681 Starlight Ct
- 670 Starlight Ct
- 1980 Russell Dr
- 1940 S High St
- 1940 Russell Dr
- 685 Bartlett Ct
- 0 Suncrest Ct Unit 183547
- 0 Suncrest Ct Unit 183543
- 0 Suncrest Ct Unit 183545
- 0 Suncrest Ct Unit 184182
- 0 Suncrest Ct Unit 184325
- 2061 John Wayland Hwy