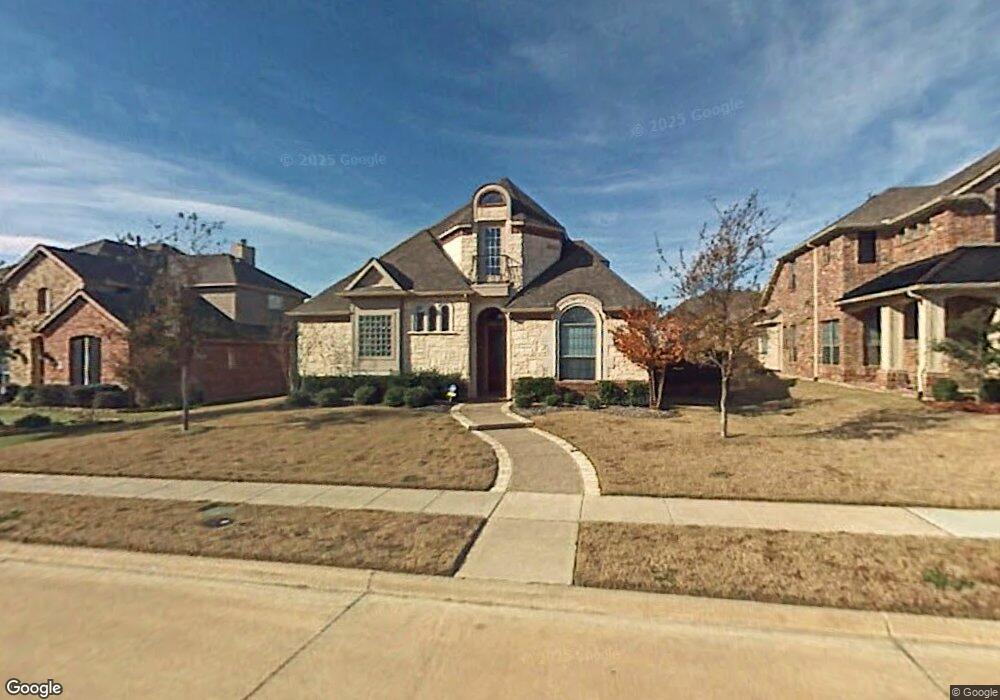
6985 Branch Trail Frisco, TX 75035
East Frisco NeighborhoodEstimated Value: $629,000 - $712,000
3
Beds
3
Baths
3,018
Sq Ft
$224/Sq Ft
Est. Value
About This Home
This home is located at 6985 Branch Trail, Frisco, TX 75035 and is currently estimated at $675,578, approximately $223 per square foot. 6985 Branch Trail is a home located in Collin County with nearby schools including Isbell Elementary School, Vandeventer Middle School, and Liberty High School.
Ownership History
Date
Name
Owned For
Owner Type
Purchase Details
Closed on
Apr 15, 2013
Sold by
D R Horton Texas Ltd
Bought by
Vasikarla Ranjeeth Kumar and Endapally Saritha
Current Estimated Value
Home Financials for this Owner
Home Financials are based on the most recent Mortgage that was taken out on this home.
Original Mortgage
$229,514
Outstanding Balance
$162,664
Interest Rate
3.56%
Mortgage Type
New Conventional
Estimated Equity
$512,914
Purchase Details
Closed on
May 12, 2011
Sold by
Dorion Jerry and Glenda Dorion Revocable L
Bought by
Kim Suk Bum and Kim Song Hee
Home Financials for this Owner
Home Financials are based on the most recent Mortgage that was taken out on this home.
Original Mortgage
$244,800
Interest Rate
4.75%
Mortgage Type
FHA
Purchase Details
Closed on
Dec 29, 2008
Sold by
Dorion Jerry and Dorion Glenda
Bought by
Dorion Jerry and Dorion Glenda
Purchase Details
Closed on
May 9, 2005
Sold by
Landstar Homes Dallas Ltd
Bought by
Dorion Jerry and Dorion Glenda
Create a Home Valuation Report for This Property
The Home Valuation Report is an in-depth analysis detailing your home's value as well as a comparison with similar homes in the area
Home Values in the Area
Average Home Value in this Area
Purchase History
| Date | Buyer | Sale Price | Title Company |
|---|---|---|---|
| Vasikarla Ranjeeth Kumar | -- | None Available | |
| Kim Suk Bum | -- | Hftc | |
| Dorion Jerry | -- | None Available | |
| Dorion Jerry | -- | Ctc |
Source: Public Records
Mortgage History
| Date | Status | Borrower | Loan Amount |
|---|---|---|---|
| Open | Vasikarla Ranjeeth Kumar | $229,514 | |
| Previous Owner | Kim Suk Bum | $244,800 |
Source: Public Records
Tax History Compared to Growth
Tax History
| Year | Tax Paid | Tax Assessment Tax Assessment Total Assessment is a certain percentage of the fair market value that is determined by local assessors to be the total taxable value of land and additions on the property. | Land | Improvement |
|---|---|---|---|---|
| 2025 | $7,773 | $611,815 | $190,000 | $496,420 |
| 2024 | $7,773 | $556,195 | $161,500 | $469,786 |
| 2023 | $7,773 | $505,632 | $147,250 | $485,284 |
| 2022 | $8,702 | $459,665 | $133,000 | $430,812 |
| 2021 | $8,203 | $417,877 | $109,250 | $308,627 |
| 2020 | $8,488 | $415,870 | $95,000 | $320,870 |
| 2019 | $8,809 | $410,000 | $95,000 | $315,000 |
| 2018 | $8,850 | $406,226 | $90,250 | $315,976 |
| 2017 | $8,403 | $389,666 | $85,500 | $304,166 |
| 2016 | $7,712 | $363,027 | $80,750 | $282,277 |
| 2015 | $6,631 | $318,743 | $80,750 | $237,993 |
Source: Public Records
Map
Nearby Homes
- 15619 Brookwood Dr
- 15372 Mountain View Ln
- 15620 Buffalo Creek Dr
- 7983 Buffaloberry Rd
- 15214 Forest Haven Ln
- 8003 Splitbeard Rd
- 8011 Splitbeard Rd
- 15577 Mountain View Ln
- 15470 Forest Haven Ln
- 15773 Waterview Dr
- 6478 Ryeworth Dr
- 6809 Royal View Dr
- 6813 Royal View Dr
- 6470 Hunters Pkwy
- 15592 Songbird St
- 6330 Hunters Pkwy
- Villa 59 at 14869 Pitcher Sage
- 15576 Adderberry Dr
- 16098 Garganey Ct
- 14831 Little Bluestem Ln
- 7019 Branch Trail
- 6971 Branch Trail
- 6994 Valley Brook Dr
- 7043 Branch Trail
- 6943 Branch Trail
- 6976 Valley Brook Dr
- 7018 Valley Brook Dr
- 7008 Branch Trail
- 6984 Branch Trail
- 7040 Valley Brook Dr
- 7032 Branch Trail
- 6946 Valley Brook Dr
- 6960 Branch Trail
- 7067 Branch Trail
- 6936 Branch Trail
- 7068 Valley Brook Dr
- 6899 Branch Trail
- 15502 Forest Creek Dr
- 6912 Branch Trail
- 15520 Forest Creek Dr