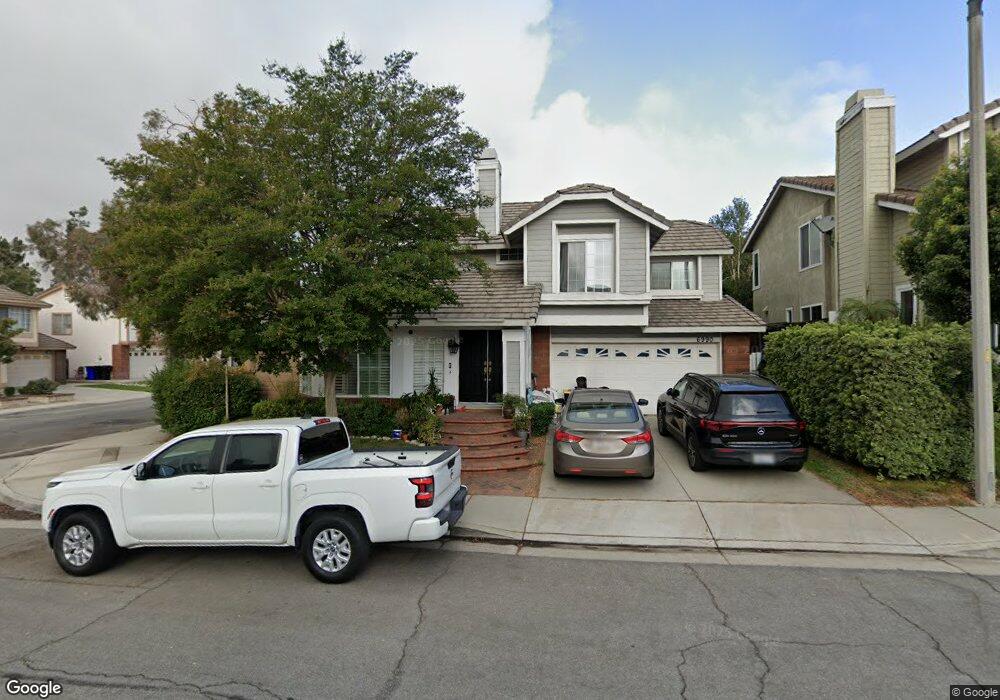
6990 Pizzoli Place Rancho Cucamonga, CA 91701
Victoria NeighborhoodEstimated Value: $724,000 - $765,000
4
Beds
3
Baths
1,545
Sq Ft
$481/Sq Ft
Est. Value
About This Home
This home is located at 6990 Pizzoli Place, Rancho Cucamonga, CA 91701 and is currently estimated at $742,403, approximately $480 per square foot. 6990 Pizzoli Place is a home located in San Bernardino County with nearby schools including Carleton P. Lightfoot Elementary, Day Creek Intermediate, and Rancho Cucamonga High School.
Ownership History
Date
Name
Owned For
Owner Type
Purchase Details
Closed on
Sep 17, 2020
Sold by
Arriaga Helena
Bought by
Arriaga Ignacio and Arriaga Helena
Current Estimated Value
Home Financials for this Owner
Home Financials are based on the most recent Mortgage that was taken out on this home.
Original Mortgage
$241,000
Outstanding Balance
$193,144
Interest Rate
2.9%
Mortgage Type
New Conventional
Estimated Equity
$549,259
Purchase Details
Closed on
Apr 16, 2007
Sold by
Arriaga Ignacio
Bought by
Arriaga Helena
Purchase Details
Closed on
Jul 24, 2000
Sold by
Arriaga Ignacio
Bought by
Arriaga Ignacio and Arriaga Helena
Home Financials for this Owner
Home Financials are based on the most recent Mortgage that was taken out on this home.
Original Mortgage
$137,950
Interest Rate
9.5%
Create a Home Valuation Report for This Property
The Home Valuation Report is an in-depth analysis detailing your home's value as well as a comparison with similar homes in the area
Home Values in the Area
Average Home Value in this Area
Purchase History
| Date | Buyer | Sale Price | Title Company |
|---|---|---|---|
| Arriaga Ignacio | -- | Bnt Title Company Of Ca | |
| Arriaga Helena | -- | Accommodation | |
| Arriaga Ignacio | -- | -- | |
| Arriaga Ignacio | $172,500 | Chicago Title Co |
Source: Public Records
Mortgage History
| Date | Status | Borrower | Loan Amount |
|---|---|---|---|
| Open | Arriaga Ignacio | $241,000 | |
| Previous Owner | Arriaga Ignacio | $137,950 | |
| Closed | Arriaga Ignacio | $25,900 |
Source: Public Records
Tax History Compared to Growth
Tax History
| Year | Tax Paid | Tax Assessment Tax Assessment Total Assessment is a certain percentage of the fair market value that is determined by local assessors to be the total taxable value of land and additions on the property. | Land | Improvement |
|---|---|---|---|---|
| 2025 | $3,561 | $259,933 | $64,984 | $194,949 |
| 2024 | $3,561 | $254,836 | $63,710 | $191,126 |
| 2023 | $3,458 | $249,839 | $62,461 | $187,378 |
| 2022 | $3,394 | $244,940 | $61,236 | $183,704 |
| 2021 | $3,333 | $240,137 | $60,035 | $180,102 |
| 2020 | $3,298 | $237,674 | $59,419 | $178,255 |
| 2019 | $3,225 | $233,014 | $58,254 | $174,760 |
| 2018 | $3,220 | $228,445 | $57,112 | $171,333 |
| 2017 | $3,088 | $223,966 | $55,992 | $167,974 |
| 2016 | $3,006 | $219,574 | $54,894 | $164,680 |
| 2015 | $2,979 | $216,275 | $54,069 | $162,206 |
| 2014 | $2,913 | $212,039 | $53,010 | $159,029 |
Source: Public Records
Map
Nearby Homes
- 6988 Edinburgh Place
- 6959 Valatta Place
- 7070 Pozallo Place
- 7139 Scalea Place
- 12164 Wembley Ct
- 11839 Larino Dr
- 11959 Huntley Dr
- 6999 Canosa Place
- 11855 Modena Dr
- 6701 Marsala Place
- 7116 Sapri Place
- 7358 Freedom Place
- 12239 Piccadilly Ct
- 7343 Legacy Place
- 11854 Novella Ct
- 12206 Tunbridge Ct
- 7067 Fontaine Place
- 6670 Meadowlane Place
- 7235 Venosa Place
- 7271 Venosa Place
- 6980 Pizzoli Place
- 6999 Belluno Place
- 6989 Belluno Place
- 6970 Pizzoli Place
- 11899 Tolentino Dr
- 6999 Pizzoli Place
- 6989 Pizzoli Place
- 6979 Belluno Place
- 11889 Tolentino Dr
- 7001 Pizzoli Place
- 6979 Pizzoli Place
- 6960 Pizzoli Place
- 11879 Tolentino Dr
- 6969 Belluno Place
- 7011 Pizzoli Place
- 11870 Tolentino Dr
- 11871 Trapani Dr
- 6969 Pizzoli Place
- 11869 Tolentino Dr
- 6950 Pizzoli Place