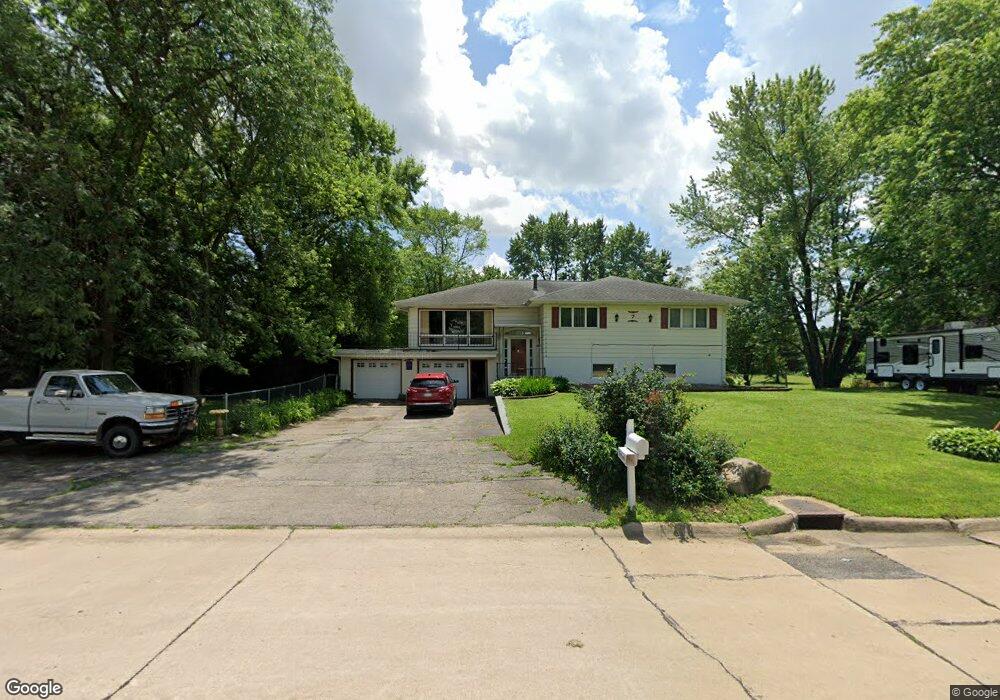
7 36th Ave SW Cedar Rapids, IA 52404
Southwest Area NeighborhoodEstimated Value: $224,000 - $229,489
3
Beds
1
Bath
2,756
Sq Ft
$83/Sq Ft
Est. Value
About This Home
This home is located at 7 36th Ave SW, Cedar Rapids, IA 52404 and is currently estimated at $227,496, approximately $82 per square foot. 7 36th Ave SW is a home located in Linn County with nearby schools including Junction City Elementary School, Grant Elementary School, and Bruce Hall Day Treatment Center.
Ownership History
Date
Name
Owned For
Owner Type
Purchase Details
Closed on
Apr 23, 2015
Sold by
Asbury United Methodist Church Of Cedar
Bought by
Black Richard R and Black Debra L
Current Estimated Value
Purchase Details
Closed on
Nov 23, 2004
Sold by
Community Savings Bank
Bought by
Black Richard R and Black Debra L
Home Financials for this Owner
Home Financials are based on the most recent Mortgage that was taken out on this home.
Original Mortgage
$127,000
Interest Rate
5.86%
Mortgage Type
Unknown
Purchase Details
Closed on
Apr 27, 2001
Sold by
Berry Dennis L and Berry Arlene A
Bought by
Miedke Steve C and Saari Kelly L
Home Financials for this Owner
Home Financials are based on the most recent Mortgage that was taken out on this home.
Original Mortgage
$131,400
Interest Rate
6.95%
Mortgage Type
Balloon
Create a Home Valuation Report for This Property
The Home Valuation Report is an in-depth analysis detailing your home's value as well as a comparison with similar homes in the area
Home Values in the Area
Average Home Value in this Area
Purchase History
| Date | Buyer | Sale Price | Title Company |
|---|---|---|---|
| Black Richard R | $20,500 | None Available | |
| Black Richard R | $126,500 | -- | |
| Miedke Steve C | $145,500 | -- |
Source: Public Records
Mortgage History
| Date | Status | Borrower | Loan Amount |
|---|---|---|---|
| Previous Owner | Black Richard R | $127,000 | |
| Previous Owner | Miedke Steve C | $131,400 |
Source: Public Records
Tax History Compared to Growth
Tax History
| Year | Tax Paid | Tax Assessment Tax Assessment Total Assessment is a certain percentage of the fair market value that is determined by local assessors to be the total taxable value of land and additions on the property. | Land | Improvement |
|---|---|---|---|---|
| 2025 | $3,486 | $268,100 | $46,500 | $221,600 |
| 2024 | $3,962 | $233,400 | $37,200 | $196,200 |
| 2023 | $3,962 | $214,500 | $37,200 | $177,300 |
| 2022 | $3,826 | $187,800 | $32,500 | $155,300 |
| 2021 | $4,024 | $184,700 | $27,900 | $156,800 |
| 2020 | $4,024 | $182,400 | $27,900 | $154,500 |
| 2019 | $3,686 | $171,000 | $27,900 | $143,100 |
| 2018 | $3,584 | $171,000 | $27,900 | $143,100 |
| 2017 | $3,550 | $163,000 | $27,900 | $135,100 |
| 2016 | $3,464 | $163,000 | $27,900 | $135,100 |
| 2015 | $3,548 | $166,738 | $27,876 | $138,862 |
| 2014 | $3,548 | $166,738 | $27,876 | $138,862 |
| 2013 | $3,472 | $166,738 | $27,876 | $138,862 |
Source: Public Records
Map
Nearby Homes
- 9 33rd Ave SW
- 3212 Southland St SW
- 42 Park Village Ave SW
- 3010 Bowling St SW
- 2937 Southland St SW
- 2955 Bowling St SW Unit E238
- 51 29th Avenue Dr SW Unit D11
- 51 29th Avenue Dr SW Unit C22
- 2818 Southland St SW
- 148 33rd Ave SW
- 2601 Teresa Dr SW
- Lot A-D 41st Avenue Dr SW
- 7000 Harlan Eddy Dr SW
- 2401 Victoria Dr SW
- 2321 Lauren Dr SW
- 2212 Deborah Dr SW
- 186 22nd Ave SW
- 2021 Hamilton St SW
- 2511 Indiana St SW
- 2417 Illinois St SW
- 11 36th Ave SW
- 15 36th Ave SW
- 10 36th Ave SW
- 0 Bowling St SW Unit 2802048
- 0 Bowling St SW Unit 2202731
- 17 36th Ave SW
- 16 36th Ave SW
- 3330 Bowling St SW
- 21 36th Ave SW
- 3340 Bowling St SW
- 3320 Bowling St SW
- 3529 Southland St SW
- 3527 Southland St SW
- 3310 Bowling St SW
- 3323 Southland St SW
- 3325 Southland St SW
- 3316 Bowling St SW
- 3300 Bowling St SW
- 7 33rd Ave SW
- 37 36th Ave SW